You may have noticed large variations in elapsed time for parallel queries while performing query tuning or observing a production workload. This post reviews some of the possible explanations for those variations. I’m testing on SQL Server 2022 RC0 but this behavior can be observed on all currently supported versions of SQL Server.
The Setup
The test data is very simple. Insert ten million sequential integers into a single column table with a clustered index:
CREATE TABLE dbo.ParallelTest (
Id BIGINT NOT NULL,
CONSTRAINT PK_ParallelTest PRIMARY KEY (Id)
);

INSERT INTO dbo.ParallelTest (Id)
SELECT [value]
FROM GENERATE_SERIES(1, 10000000);
Now consider the following query:
SELECT SUM(a.ID + b.ID) s
FROM dbo.ParallelTest a
INNER JOIN dbo.ParallelTest b ON a.ID = b.ID
OPTION (USE HINT ('DISALLOW_BATCH_MODE'));
The query optimizer naturally picks a merge join for this query. The self-joined tables obviously have the same row count and the data is already sorted. That makes this query an ideal candidate for a serial merge join from the optimizer’s point of view . The USE HINT in the query isn’t particularly important and the example works without it, but its presence will be explained later. Here’s what the query plan looks like for me:
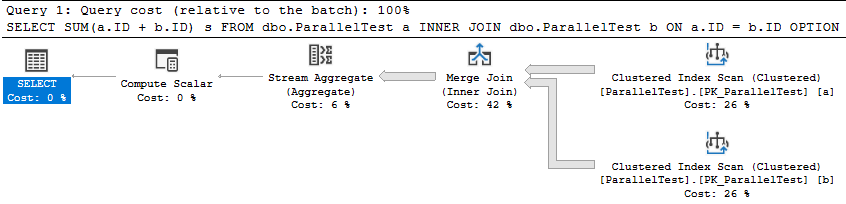
The query takes 2721 ms of CPU time and elapsed time to execute on my machine. It’s reasonable for CPU and elapsed time to match here because there’s nothing for the query to wait on. It’s the only user query running against the SQL instance. Next I’ll force a parallel merge join query plan by changing the query hints to the following:
SELECT SUM(a.ID + b.ID) s
FROM dbo.ParallelTest a
INNER JOIN dbo.ParallelTest b ON a.ID = b.ID
OPTION (MAXDOP 8, MERGE JOIN, USE HINT('ENABLE_PARALLEL_PLAN_PREFERENCE', 'DISALLOW_BATCH_MODE'));
I chose MAXDOP 8 because my test machine has 8 physical CPU cores. This is an unnatural query plan with a higher parallel cost than serial cost. The query optimizer only picked it because it was forced to. Note the presence of the exchange operators with a relatively high estimated cost:
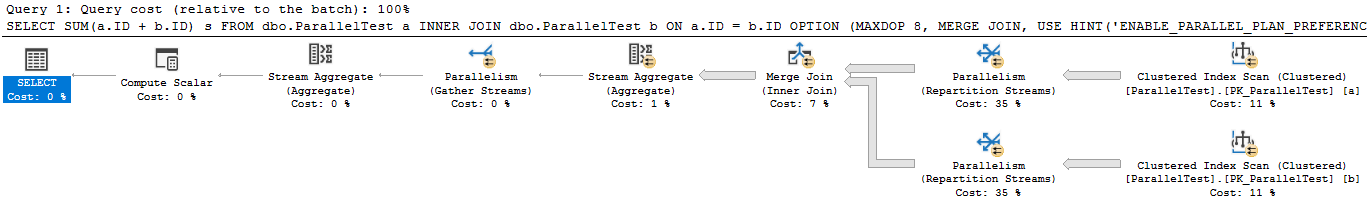
The parallel query takes 6465 ms of CPU time and 1723 ms of elapsed time to execute on my machine. It finished about 33% faster than the serial query but CPU time more than doubled. The exchange operators added a large overhead for this query. Next I’ll run the same query again but I’ll make one of my CPUs busier than before. Consider the following infinite loop coded as a stored procedure:
CREATE OR ALTER PROCEDURE #p AS
SET NOCOUNT ON;
DECLARE @i INT;
WHILE 1 = 1
SET @i = 0;
GO

EXEC #p;
This code does not accomplish anything besides efficiently using CPU resources, which is exactly what I need for my test. I’m running the merge query at MAXDOP 8 on a machine with 8 CPU cores so I’m pretty much guaranteed to see scheduler contention for some of the workers of the parallel query. They will compete for CPU resources with the infinite loop.
Take a moment to predict the performance penalty that the parallel query will experience due to the busy scheduler. Will it be 2X slower? 3X slower? Worse? For a few hints, recall that hash distributed exchange operators will generally try to force an equal amount of work to each thread. Also recall that a parallel merge join requires order-preserving exchange operators. I’ve included Erik running at MAXDOP 8 to hopefully prevent you from accidentally seeing the answer before you’ve finalized your prediction.

With the busy scheduler, the query now takes 6818 ms of CPU time and 31745 ms of elapsed time to execute on my machine. The same code is over 18X slower simply due to the highly efficient stored procedure that’s running on the same SQL instance. Here are the query wait stats in case they are of interest:
<Wait WaitType=”CXPACKET” WaitTimeMs=”454673″ WaitCount=”5262″ />
<Wait WaitType=”CXSYNC_PORT” WaitTimeMs=”32539″ WaitCount=”41″ />
<Wait WaitType=”CXSYNC_CONSUMER” WaitTimeMs=”43″ WaitCount=”14″ />
scheduler_ring_buffer_recorded
This is an inappropriately brief introduction to a complex topic, but workers cooperate with each other by sharing time on schedulers. Under normal conditions, a worker will execute code on the scheduler for up to 4 milliseconds before yielding. The worker yields in case there’s another worker waiting to execute on the scheduler. When there’s not the original worker immediately starts executing code again. An example of when a worker yields early is if it needs to wait for an I/O operation.
scheduler_ring_buffer_recorded is the name of a debug extended event that you should probably never use. I often don’t follow my own advice, so I used it to get an idea of how often workers were yielding to the scheduler for the merge join queries. I only looked at action types of “SCHEDULER_NONPREEMPTIVE_RESUME” and I admit that this analysis is quite approximate. For the MAXDOP 1 query, there was a total of 705 events over 2872 milliseconds. In other words, the average time spent on the scheduler before yielding is close to the 4 ms soft maximum. This should be expected for the serial query if all of the data is in the buffer pool. There is no memory grant for the query (the reason for the USE HINT) and there’s not really any reason to yield early.
The parallel query had significantly more yields. Looking at one worker thread as an example, it had 14862 events over 1714 milliseconds. In other words, it had around 35 times the number of scheduler yields compared to the MAXDOP 1 query. The higher number of yields is a performance liability when competing with workers from other queries on the same scheduler. The infinite loop stored procedure dominates the workers from the parallel and gets around 97% of the cpu time on the scheduler. That’s a big part of why the parallel query is 18X slower than before.
Note that you can also get this information by looking at the yield_count column of the sys.dm_of_schedulers DMV, but those numbers are server wide and aren’t isolated to one query. With that said, I did get reasonably similar results when comparing that column to the extended event results.
To summarize, parallel query performance overhead isn’t as simple as just the direct overhead of the exchange operators. A query changing from serial to parallel can result in completely different interactions between the workers and the scheduler. The serial query executed its code 4 milliseconds at a time. The parallel query had to yield significantly more often. This type of change isn’t something that you can directly observe in a query plan.
Why Parallel Queries are Sometimes Slow
There are many reasons why a parallel query may not be as efficient as you hoped. I find these to be the most common:
1) There is an overhead associated with parallel exchange operators which is not present in serial queries. Moving data between worker threads requires additional CPU time which adds to the overall execution time of the query. I believe this is what is described by the following quote from the documentation:
Simple queries, frequently found in transaction processing applications, find the additional coordination required to execute a query in parallel outweigh the potential performance boost.
2) There’s some kind of additional coordination required between threads which delays query completion. For example, an order-preserving repartition streams operator is generally worse for performance than one that doesn’t need to preserve order. A different type of example can be seen in my blog post about slow parallel scans caused by cloud storage.
3) Work may be unevenly distributed between worker threads. For example, an eager index spool can only be built with one thread. Other threads may be idle while that temporary index is built. For a different example, a filtered parallel scan of a table may not output the same number of rows to all threads. All else being equal, a parallel query that cannot use all of the CPUs allowed by MAXDOP is not as efficient as one that can.
4) Work may be evenly distributed between worker threads but some of the CPUs are busier than others. Some parallel queries are as slow as their busiest CPU, even when queries are evenly sharing time on the scheduler. Of course, dramatic performance penalties can be seen when the parallel query gets an uneven amount of time on the scheduler (like in the demo in this blog post).
Mitigations
Individual parallel query performance can degrade due to contention on a single scheduler that’s used by one or more of its workers. You are more likely to run into problems with higher DOP or a higher number of concurrent queries. Lowering MAXDOP decreases the odds that you’ll run into the worst type of contention because the query uses fewer schedulers. Decreasing the number of queries decreases contention per scheduler which also helps.
To explain it in a different way, the simplest way to reduce problems with parallel queries is to have fewer worker threads per scheduler. This is of course a balancing act, but it’s one that you must perform for some workloads. Set Cost Threshold for Parallelism and server/database/resource governor MAXDOP appropriately. When possible, don’t run too many concurrent queries for your hardware.
For very important queries for which performance is critical, consider changing to a type of parallelism that isn’t as susceptible to scheduler contention issues. The two most common methods are a parallel apply pattern, perhaps using demand partitioning, or batch mode execution.
Batch mode is yet another complicated topic that I’m not going to explain here, but it uses a fundamentally different method of parallelism compared to row-mode execution which is generally much more robust against problems caused by busy schedulers. Below is a comparison of elapsed times with and without the infinite loop stored procedure running:
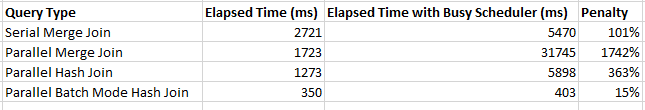
The elapsed time of the parallel batch mode query only changes slightly. This is also a nice property when considering overall server scalability.
Final Thoughts
I was going to originally blog about DOP feedback, but it’s taking a while for my feedback to kick in. Thanks for reading!
“I’ve included Erik running at MAXDOP 8”
Terrifying
p.s. Great article