End Of The Line
There are a lot of words you can use to describe Extended Events. I’ll skip over my list to keep the blog family friendly.
In this post, we’re going to look at how two event can show the same query having a different plan handle.
I stumbled on this while working on sp_HumanEvents, when one of my precious sessions suddenly STOPPED RETURNING RESULTS.
Very helpful.
Let’s look at why.
A Plan Here, A Plan There
When the optimizer gets its hands on a query, it has some early choices, where it might choose to keep a plan at the trivial optimization level, and it may choose simple parameterization in order to make things more re-usable.
Apparently this causes some differences when it comes to hashing plans.
Here’s an example query:
SELECT COUNT(*) FROM dbo.Votes WHERE BountyAmount = 500 AND UserId = 22565;
Looking at the execution plan for it, we know a couple things.
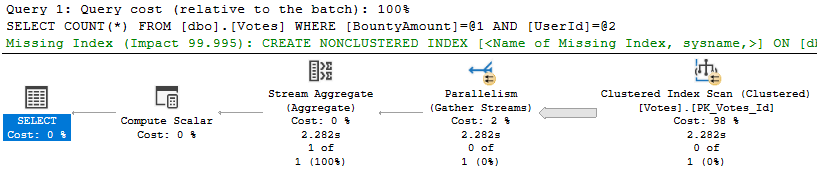
It didn’t stay trivial because it went parallel, and the optimizer thought that simple parameterization was a good idea. Even though we passed in literals, they’re replaced by parameters in the execution plan text.
What’s the big deal?
Well, nothing, unless you want to correlate information about a single query from multiple Extended Events.
Check It Out
Let’s run sp_HumanEvents and get debug information — because the regular results won’t return anything for this query right now (I have fixed this issue, don’t worry).
EXEC sp_HumanEvents @event_type = N'query', @debug = 1, @seconds_sample = 5;
In another window, we’ll run our query.
SELECT COUNT(*) FROM dbo.Votes WHERE BountyAmount = 500 AND UserId = 22565;
What do we get back? The debug parameter will spit out data in temp tables, and print out dynamic SQL commands for troubleshooting.
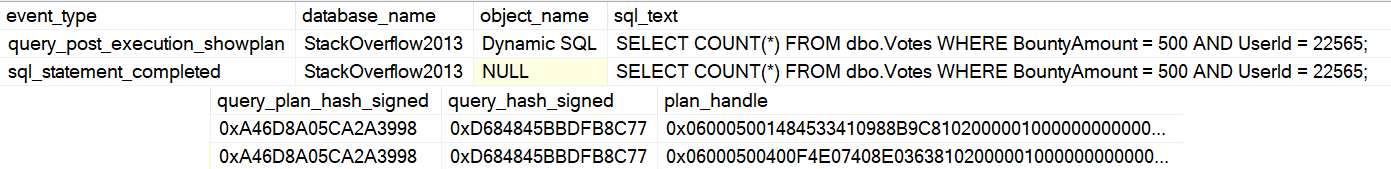
Eagle-eyed readers will notice that the plan handles in each event for the same query are different, but query hash and plan hash are identical.
Because of this, I’ve had to change the way I get plan handles, so I only take the one that comes from post execution showplan, because…
There’s Another Way
Which plan_handle ends up in your plan cache? Not the one from sql_statement_completed.
We can see that by running sp_HumanEvents to capture wait stats, which will also try to correlate waits to the queries that caused them.
EXEC sp_HumanEvents @event_type = N'waits', @debug = 1, @seconds_sample = 5;
I’m grabbing the debug here too so we can see what ends up in the temp tables along the way.

We can grab information about which queries caused waits, and the plan handle here is the same one that we saw in the post execution showplan event.
Yay?
In the Actual Results Plus from sp_HumanEvents, we can see the simple parameterized version of the query ended up in the plan cache.

There are two lines here because we had waits on two different wait stats, but the point is more that we can see simple parameterization at work here, but not in the events that collected information about executed queries.
Frustration Point
The problem would have been more obvious if the parameterized text showed up in the post execution showplan event, and not the version with literal values. It would have been easier to figure out why the plan handles were different, anyway.
So what’s the solution? Now, sp_HumanEvents will only get the plan handle from the post execution showplan event, in case you want to go and do anything with it later.
Thanks for reading!
Going Further
If this is the kind of SQL Server stuff you love learning about, you’ll love my training. I’m offering a 75% discount to my blog readers if you click from here. I’m also available for consulting if you just don’t have time for that and need to solve performance problems quickly.