Dragging The Line
There’s a lot of stuff flying around in a query plan. Data and what not.
Sure, you can hover over operators and arrows and see some stuff, but if you really wanna see stuff — I mean REALLY wanna see stuff — you gotta get into the properties.
You can access those in two ways:
- Hit F4 (not F5 again; you already suffered through that)
- Right click on any operator in the query plan and hit Properties
And that, my dear friend, will unlock many mysteries in your query plans.
Start With Select
I think one of the most interesting places to start is with the root operator (select, insert, update, delete), because there’s so much in there.
Here’s an abridged list of things you can see from the properties of the root node of an Actual Execution Plan:
- Compile metrics: CPU, duration, memory
- Degree Of Parallelism
- Detailed Memory Grant information
- Stats Usage
- Query Time Stats in CPU and duration (including UDF times)
- Parameter compile and runtime values
- Nonparallel Plan reasons
- Set Options
- Warnings
- CPU thread usage
- Wait Stats
There’s more in there too, but holy cow! All the stuff you can learn here is fantastic. You might not be able to solve all your problems looking here, but it’s as good a place to start as any.
Plus, this is where you can get a sense of just how long your query ran for, and start tracking down the most troublesome operators.
Follow The Time
I’ve said before that operator costs are basically useless, and you should be following the operator times to figure out where things get wonky.
For some operators, just looking at the tool tip is enough. For example, if you have an operator that piles up a bunch of execution time because of a spill, the spill details are right in front of you.
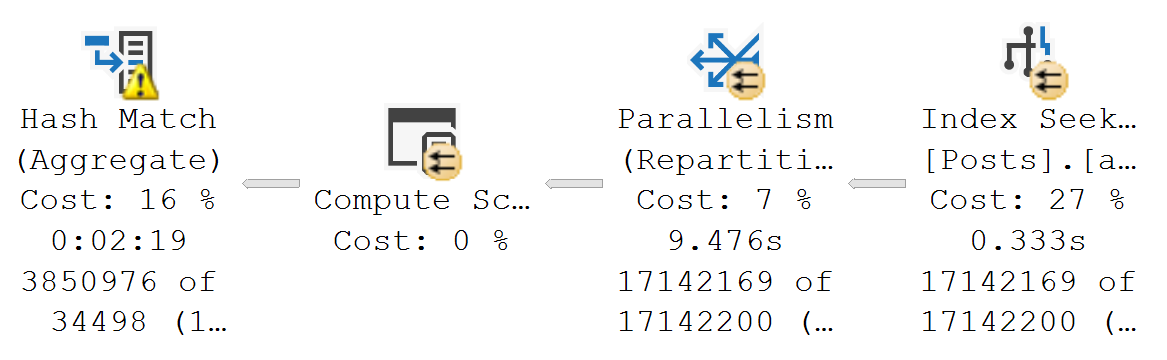
But other times, operator properties expose things that aren’t surfaced at the tool tip.
Skew Manchu
Take skewed parallelism, for example. There are no visual indicators that it happened (maybe there should be, but given the warnings we get now, I’m not sure I trust that summer intern).
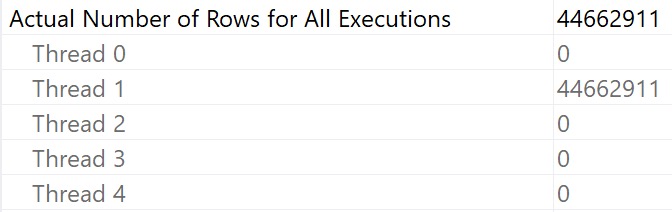
But you know, it might be nice to know about stuff like this. Each thread is supposed to get an equal portion of the query memory grant, and if work is distributed unevenly, you can end up with weird, random performance issues.
This is something I almost always spot check in parallel plans. In a perfect world, duration would be CPU➗DOP. Life rarely ends up perfect, which is why it’s worth a look.
I To The O
You can also see I/O stats at the operator level, logical and physical. This is why I kinda laugh at folks who still use SET STATISTICS TIME, IO ON; — you can get that all in one place — your query plan.
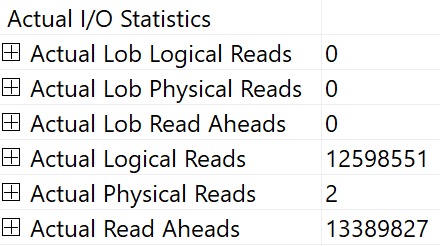
You can interpret things in the same way, it’s just a little easier to chew.
Thanks for reading!
Going Further
If this is the kind of SQL Server stuff you love learning about, you’ll love my training. I’m offering a 75% discount to my blog readers if you click from here. I’m also available for consulting if you just don’t have time for that and need to solve performance problems quickly.
You said “laugh at folks who still use SET STATISTICS TIME, IO ON”
I understand your point, and agree with it , when there is a “normal” query.
What we can do, when we are in front of a view with 20+ tables/views in FROM, and my monitor doesn’t “cover” the execution plan? been like an ugly bug from a SF movie?
In this case, from my point, the SET SSTATISTICS IO is easier , and take it from there…
Well, what good does that do you? You’re better off following the operator times than looking at the CPU/duration as a whole, or caring about useless metrics like logical reads.
Next time when there will be such a query , I will take a look at the operator times , hopping for a detached “winner” 🙂 , usually is not a clear “winner” , few seconds here , few there
BR
This was an excellent series Erik! Thanks.
Aw, thanks! Glad you liked it!