Updates To sp_QuickieStore, sp_HealthParser, and sp_PressureDetector

sp_QuickieStore


The Darling Data machine has been hard at work making the bits and bins and whatnots work better.

You can download all of the main SQL Server troubleshooting procedures I use in one convenient file.

Okay, so like, maybe not all that hard at work, and we I had some help with a funny bug, stemming from a recent Pull Request. The Read Me file has been updated to reflect the newest parameters.

Let’s start with giving some credit, here, since I hate an overdue bill.

ReeceGoding reported and very capably fixed an issue with sp_QuickieStore. The problem only occurred when you ran the procedure with @get_all_databases and the new @escape_brackets parameter set to true. Each loop would add an escape character to the search string, which could end up looking like this: %\\\\\[AnyStringStartingAndEndingWithSquareBrackets]\\\\\]%'

The good news is that it’s fixed now. A big round of applesauce for that. It’s the only substantial change to sp_QuickieStore.

Now, on to the other stuff!

sp_HealthParser


I had to make a bunch of adjustments in here. I was testing out some stuff and hoping that I could make it work, but the math just wasn’t there. Or the maths just weren’t there, if you’re into multiple maths.

For the wait stats sections, I’ve removed the “total wait time” column. It just didn’t make any sense, because the only information that I had was the total number of waits, the average number of waits, and the maximum wait time. I was hoping I could get sensible numbers by multiplying the total and average, and adding the max wait time to that. The problem is that the numbers were huge. Enormous. Senseless.

The other thing I had to do some work on was in the “waits by duration” section. It seemed like the results would just re-report on every collection cycle, even if no new waits had occurred. It would make things look like you had the same waits in every grouped block of time. Via the magic of windowing functions, I weed out absolute duplicates, and only show where the wait stats report something new. As part of this, I also filter out waits with a low average duration (less than 500ms by default). You can change this behavior by using the @wait_duration_ms parameter.

Another thing that I set a threshold on was in the “cpu task details” section. In there, it would show sections with a warning logged to the system health extended event. The problem was mainly that a warning would be logged whenever there was even a single pending task (query waiting to get on a CPU). Having just one of those is not a very interesting sign of CPU pressure, so there’s a parameter called @pending_task_threshold that defaults to 10 which you can use to decide how many pending tasks matter to you.

sp_PressureDetector


This is perhaps the biggest update! It hadn’t changed much in a while, and I wanted to get a little more out of what SQL Server has to offer.

The big changes are:

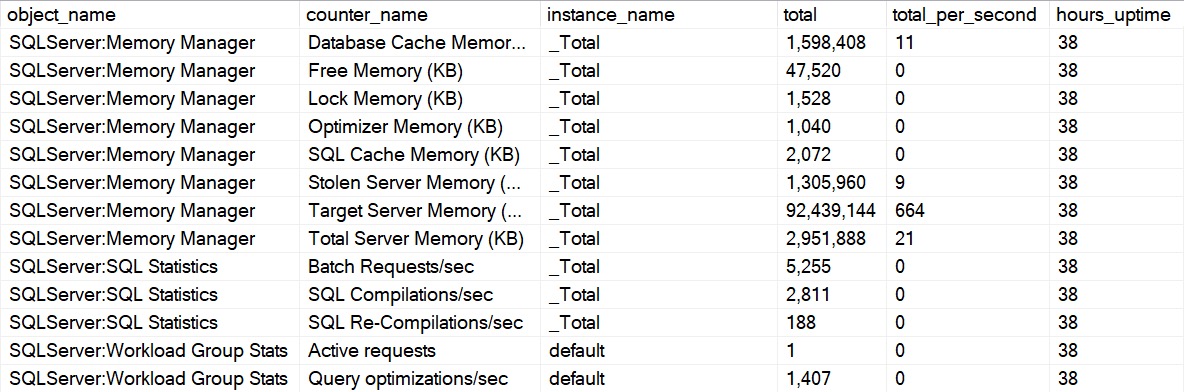
  • Added in some useful PerfMon counters to the results
  • Added the ability to sample server activity

When you run sp_PressureDetector the “normal” way, it’ll show you perfmon counter activity since startup. I only collect specific ones though, and only specific counter types. See, there are a variety of types of counters.

The math to figure out how much of something happened during a period of time is about the same for all of them, but I found looking through the various categories and specific counters, that only those that come from types 272696576 and 65792, and only certain ones within those.

The new section will look something like this:

sql server query results
perf, mon

If you decide that you don’t care about perfmon counters, you can skip that section by using the @skip_perfmon parameter.

The sampling code was inspired by running into some client issues where hitting F5 was okay, but remembering what all the numbers were before to compare them to after. You can run the sampling code by doing this:

EXEC sp_PressureDetector
    @sample_seconds = 5;

Not every section supports this yet. I started with the ones that I thought would benefit the most:

  • Wait stats
  • File stats
  • Perfmon counters

I may add it to more later, but these are good enough for now. The easy way to think about it is that only sections with a “sample_seconds” column in them are sampled. The rest are current.

Look for a video walkthrough of the latest round of changes.

Again, you can download all of the main SQL Server troubleshooting procedures I use in one convenient file.

Issues and Contributions


If you’d like to report an issue, request or contribute a feature, or ask a question about any of these procedures, please use my GitHub repo. Specifically, check out the contributing guide.

As happy as I am to get emails about things, it makes support difficult for the one-man party that I am. Personal support costs money. Public support is free. Take your pick, there!

Thanks for reading!

Going Further


If this is the kind of SQL Server stuff you love learning about, you’ll love my training. I’m offering a 75% discount to my blog readers if you click from here. I’m also available for consulting if you just don’t have time for that, and need to solve database performance problems quickly. You can also get a quick, low cost health check with no phone time required.

SQL Server Query Transformations With ROW_NUMBER And ANY Aggregates

SQL Server Query Transformations With ROW_NUMBER And ANY Aggregates


Going Further


If this is the kind of SQL Server stuff you love learning about, you’ll love my training. I’m offering a 75% discount to my blog readers if you click from here. I’m also available for consulting if you just don’t have time for that, and need to solve database performance problems quickly. You can also get a quick, low cost health check with no phone time required.

Returning A Row When Your Query Has No Results

Canary


Empty results are often dissatisfying. Especially when stored procedures return multiple result sets, it can be easy to get lost in which result is empty.

Of course, there’s many a good argument to be made against actual production stored procedures returning multiple results — usually these should be multiple procedures — I see it happen quite a lot.

Rather selfishly, I do this for my stored procedures, for all the reasons in the first sentence. Especially when debugging stored procedures, you’ll want to know where things potentially went wrong.

In this post, I’m going to walk through a couple different ways that I use to do this. One when you’re storing intermediate results in a temporary object, and one when you’re just using a single query.

Intermediate


This is fairly obvious and straightforward. You do the insert, check the row count, and return a message if it’s zero:

DECLARE
    @t table
(
    database_id integer,
    database_name sysname
);

INSERT
    @t
(
    database_id,
    database_name
)
SELECT
    d.database_id,
    d.name
FROM sys.databases AS d
WHERE d.database_id > 32767;

IF @@ROWCOUNT > 0
BEGIN
    SELECT
        t.*
    FROM @t AS t;
END;
ELSE
BEGIN
    SELECT
        msg = 'table @t is empty!'
END;

Nothing new under the sun in this one at all.

All In One


Let’s say you don’t want or need a temporary object. Your query is good enough, smart enough, and gosh darn it etc.

This is a particularly tricky one, because there’s no way to check the row count from within the query. In this case, you can use a common table expression in a rather handy way.

WITH
    d AS
(
    SELECT
        d.database_id,
        d.name
    FROM sys.databases AS d
    WHERE d.database_id > 32766
)
SELECT
    d.*
FROM d

UNION ALL

SELECT
    0,
    'table @t is empty!'
WHERE NOT EXISTS
(
    SELECT
        1/0
    FROM d AS d2
);

Of course, the usual caveats about common table expressions bear repeating here: The query within the common table expression will run twice:

  1. Once when we select from it outside the CTE
  2. Once when we check for the existence of rows in the CTE

I don’t recommend this approach for long running queries within common table expressions, since this is essentially double your displeasure, double your misery.

Thanks for reading!

Going Further


If this is the kind of SQL Server stuff you love learning about, you’ll love my training. I’m offering a 75% discount to my blog readers if you click from here. I’m also available for consulting if you just don’t have time for that, and need to solve database performance problems quickly. You can also get a quick, low cost health check with no phone time required.

bit Obscene Episode 3: The Habits Of Highly Successful Performance Tuners

bit Obscene Episode 3: The Habits Of Highly Successful Performance Tuners


Thanks for watching!

Going Further


If this is the kind of SQL Server stuff you love learning about, you’ll love my training. I’m offering a 75% discount to my blog readers if you click from here. I’m also available for consulting if you just don’t have time for that, and need to solve database performance problems quickly. You can also get a quick, low cost health check with no phone time required.

Join me In Boston May 10 For A Full Day Of SQL Server Performance Tuning Training

Spring Training


This May, I’ll be presenting my full day training session The Foundations Of SQL Server Performance Tuning.

All attendees will get free access for life to my SQL Server performance tuning training. That’s about 25 hours of great content.

Get your tickets here for this event, taking place Friday, May 10th 2024 at the Microsoft Offices in Burlington.

Here’s what I’ll be presenting:

The Foundations Of SQL Server Performance Tuning

Session Abstract:

Whether you want to be the next great query tuning wizard, or you just need to learn how to start solving tough business problems at work, you need a solid understanding of not only what makes things fast, but also what makes them slow.

I work with consulting clients worldwide fixing complex SQL Server performance problems. I want to teach you how to do the same thing using the same troubleshooting tools and techniques I do.

I’m going to crack open my bag of tricks and show you exactly how I find which queries to tune, indexes to add, and changes to make. In this day long session, you’re going to learn about hardware, query rewrites that work, effective index design patterns, and more.

Before you get to the cutting edge, you need to have a good foundation. I’m going to teach you how to find and fix performance problems with confidence.

Event Details:

Get your tickets here for this event!

Going Further


If this is the kind of SQL Server stuff you love learning about, you’ll love my training. I’m offering a 75% discount to my blog readers if you click from here. I’m also available for consulting if you just don’t have time for that, and need to solve database performance problems quickly. You can also get a quick, low cost health check with no phone time required.

A Little About sp_getapplock And Error Handling In SQL Server

A Little About sp_getapplock And Error Handling In SQL Server


Going Further


If this is the kind of SQL Server stuff you love learning about, you’ll love my training. I’m offering a 75% discount to my blog readers if you click from here. I’m also available for consulting if you just don’t have time for that, and need to solve database performance problems quickly. You can also get a quick, low cost health check with no phone time required.

Why INSERT/EXEC Causes Weird Blocking In SQL Server

Why INSERT/EXEC Causes Weird Blocking In SQL Server


Going Further


If this is the kind of SQL Server stuff you love learning about, you’ll love my training. I’m offering a 75% discount to my blog readers if you click from here. I’m also available for consulting if you just don’t have time for that, and need to solve database performance problems quickly. You can also get a quick, low cost health check with no phone time required.

Darling Data Expands Its Social Media Influence Empire To TikTok #TikTok

Clampdown


Darling Data was born too late for MySpace, Friendster, Facebook, and Make Out Club (MOC).

While I patiently wait for 4chan to make business accounts available, I figured I’d try out something new.

So, you can find bite (byte?) sized chunks of my videos on TikTok here: Darling Data

I’ve also hired my wife (clearly a nepo baby) as a social media intern to slice, dice, edit, caption, #hashtag, and add complimentary gifs to the clips.

If I’m not careful, she’ll be better at SQL Server than me by the time this goes to international media outlets. I would have hired her to write this press release, but she went to bed.

Since I’m clearly not good at these things, please do the TikTok version of liking and subscribing over there, fellow kids.

This post was brought to you by the Senior Executive Management Team at Darling Data, a subsidiary of Beer Gut Magazine, Inc.

Thanks for reading!

Going Further


If this is the kind of SQL Server stuff you love learning about, you’ll love my training. I’m offering a 75% discount to my blog readers if you click from here. I’m also available for consulting if you just don’t have time for that, and need to solve database performance problems quickly. You can also get a quick, low cost health check with no phone time required.

A Little About RESOURCE_SEMAPHORE_QUERY_COMPILE Waits In SQL Server

A Little About RESOURCE_SEMAPHORE_QUERY_COMPILE Waits In SQL Server


Going Further


If this is the kind of SQL Server stuff you love learning about, you’ll love my training. I’m offering a 75% discount to my blog readers if you click from here. I’m also available for consulting if you just don’t have time for that, and need to solve database performance problems quickly. You can also get a quick, low cost health check with no phone time required.

Join me In Boston May 10 For A Full Day Of SQL Server Performance Tuning Training

Spring Training


This May, I’ll be presenting my full day training session The Foundations Of SQL Server Performance Tuning.

All attendees will get free access for life to my SQL Server performance tuning training. That’s about 25 hours of great content.

Get your tickets here for this event, taking place Friday, May 10th 2024 at the Microsoft Offices in Burlington.

Here’s what I’ll be presenting:

The Foundations Of SQL Server Performance Tuning

Session Abstract:

Whether you want to be the next great query tuning wizard, or you just need to learn how to start solving tough business problems at work, you need a solid understanding of not only what makes things fast, but also what makes them slow.

I work with consulting clients worldwide fixing complex SQL Server performance problems. I want to teach you how to do the same thing using the same troubleshooting tools and techniques I do.

I’m going to crack open my bag of tricks and show you exactly how I find which queries to tune, indexes to add, and changes to make. In this day long session, you’re going to learn about hardware, query rewrites that work, effective index design patterns, and more.

Before you get to the cutting edge, you need to have a good foundation. I’m going to teach you how to find and fix performance problems with confidence.

Event Details:

Get your tickets here for this event!

Going Further


If this is the kind of SQL Server stuff you love learning about, you’ll love my training. I’m offering a 75% discount to my blog readers if you click from here. I’m also available for consulting if you just don’t have time for that, and need to solve database performance problems quickly. You can also get a quick, low cost health check with no phone time required.