A Little About sp_getapplock And Error Handling In SQL Server
Going Further
If this is the kind of SQL Server stuff you love learning about, you’ll love my training. I’m offering a 75% discount to my blog readers if you click from here. I’m also available for consulting if you just don’t have time for that, and need to solve database performance problems quickly. You can also get a quick, low cost health check with no phone time required.
Why INSERT/EXEC Causes Weird Blocking In SQL Server
Going Further
If this is the kind of SQL Server stuff you love learning about, you’ll love my training. I’m offering a 75% discount to my blog readers if you click from here. I’m also available for consulting if you just don’t have time for that, and need to solve database performance problems quickly. You can also get a quick, low cost health check with no phone time required.
Darling Data was born too late for MySpace, Friendster, Facebook, and Make Out Club (MOC).
While I patiently wait for 4chan to make business accounts available, I figured I’d try out something new.
So, you can find bite (byte?) sized chunks of my videos on TikTok here: Darling Data
I’ve also hired my wife (clearly a nepo baby) as a social media intern to slice, dice, edit, caption, #hashtag, and add complimentary gifs to the clips.
If I’m not careful, she’ll be better at SQL Server than me by the time this goes to international media outlets. I would have hired her to write this press release, but she went to bed.
Since I’m clearly not good at these things, please do the TikTok version of liking and subscribing over there, fellow kids.
This post was brought to you by the Senior Executive Management Team at Darling Data, a subsidiary of Beer Gut Magazine, Inc.
Thanks for reading!
Going Further
If this is the kind of SQL Server stuff you love learning about, you’ll love my training. I’m offering a 75% discount to my blog readers if you click from here. I’m also available for consulting if you just don’t have time for that, and need to solve database performance problems quickly. You can also get a quick, low cost health check with no phone time required.
A Little About RESOURCE_SEMAPHORE_QUERY_COMPILE Waits In SQL Server
Going Further
If this is the kind of SQL Server stuff you love learning about, you’ll love my training. I’m offering a 75% discount to my blog readers if you click from here. I’m also available for consulting if you just don’t have time for that, and need to solve database performance problems quickly. You can also get a quick, low cost health check with no phone time required.
Whether you want to be the next great query tuning wizard, or you just need to learn how to start solving tough business problems at work, you need a solid understanding of not only what makes things fast, but also what makes them slow.
I work with consulting clients worldwide fixing complex SQL Server performance problems. I want to teach you how to do the same thing using the same troubleshooting tools and techniques I do.
I’m going to crack open my bag of tricks and show you exactly how I find which queries to tune, indexes to add, and changes to make. In this day long session, you’re going to learn about hardware, query rewrites that work, effective index design patterns, and more.
Before you get to the cutting edge, you need to have a good foundation. I’m going to teach you how to find and fix performance problems with confidence.
If this is the kind of SQL Server stuff you love learning about, you’ll love my training. I’m offering a 75% discount to my blog readers if you click from here. I’m also available for consulting if you just don’t have time for that, and need to solve database performance problems quickly. You can also get a quick, low cost health check with no phone time required.
I was quite publicly mystified by the coupling of Azure Data Studio into the SQL Server Management Studio installer. They’re different tools for different people.
This isn’t a tirade against Azure Data Studio, nor is it a victory lap since apparently the feedback item I posted was part of the decision to remove it.
This is purely informational, since the announcement that it’s not in there anymore is nearly as quiet as the announcement that it was being included back in SQL Server Management Studio 18.7, and only slightly louder than the availability of a command line switch to skip installing it.
Back when I initially complained about the inability to skip installing Azure Data Studio, there was a lot of talk about how SQL Server Management Studio would increasingly rely on it for new functionality. I suppose that was either untrue, or the roadmap changed significantly.
Quite cynically, I thought it was a cheap way to increase the install base of a new product, but who knows? I assume Microsoft has better telemetry about usage than binaries just existing. Again, who knows?
A further miffance was that you could download and install Azure Data Studio independently, but not SQL Server Management Studio.
For SSMS 20 we have removed Azure Data Studio from the installation. In addition to being a highly voted item (Make ADS An Optional Install Alongside SSMS · Community (azure.com)), this aligns with the future extension work for SSMS 21 and we decided to make the change in the current release.
So, hooray! Dreams do come true, etc. When I was but a young boy, I dreamed that someday my desires would be aligned with future extension work for SSMS.
I’d also like to say here that being the public face of SQL Server Management Studio makes Erin Stellato about the bravest soul I know. It’s a tool that millions of people rely on, and nearly everyone actively complains about. Part of my RSS feed is not only posts from Microsoft about data platform related stuff, but also the comment feed. She has saintly patience in her responses to the comments on these things. Comments on the internet maintain their position and title as the worst things on earth. Erin deserves infinite credit for doing the job that she does as well as she does it.
If you’re still stuck using older versions because of a new bug or an old feature, you can skip installing Azure Data Studio by running the installer via the command prompt:
If this is the kind of SQL Server stuff you love learning about, you’ll love my training. I’m offering a 75% discount to my blog readers if you click from here. I’m also available for consulting if you just don’t have time for that, and need to solve database performance problems quickly. You can also get a quick, low cost health check with no phone time required.
If this is the kind of SQL Server stuff you love learning about, you’ll love my training. I’m offering a 75% discount to my blog readers if you click from here. I’m also available for consulting if you just don’t have time for that, and need to solve database performance problems quickly. You can also get a quick, low cost health check with no phone time required.
I have never once seen anyone use these. The most glaring issue with them is that unlike a lot of other directives in SQL, these ones just don’t do a good job of telling you what they do, and their behavior is sort of weird.
Unlike EXISTS and NOT EXISTS, which state their case very plainly, as do UNION and UNION ALL, figuring these out is not the most straightforward thing. Especially since INTERSECT has operator precedence rules that many other directives do not.
INTERSECT gives you a set of unique rows from both queries
EXCEPT gives you a set of unique rows from the “first” query
So, cool, if you know you want a unique set of rows from somewhere, these are good places to start.
What’s better, is that they handle NULL values without a lot of overly-protective syntax with ISNULL, COALESCE, or expansive and confusing OR logic.
The tricky part is spotting when you should use these things, and how to write a query that makes the most of them.
And in what order.
Easy Examples
Often the best way to get a feel for how things work is to run simple queries and test the results vs. your expectations, whatever they may be.
I like these queries, because the UserId column in the Comments table is not only NULLable, but contains actual NULLs. Wild, right?
SELECT
    c.*
FROM dbo.Comments AS c
WHERE c.UserId IS NULL
AND   c.Score > 2

INTERSECT

SELECT
    c.*
FROM dbo.Comments AS c
WHERE c.UserId IS NULL
AND   c.Score > 3
ORDER BY
    c.Score;
Running this will return results where a Comment’s Score is greater than 3 only, because that’s the starting point for where both query results begin to match results across all the columns.
Note that the UserId column being NULL doesn’t pose any problems here, and doesn’t require any special handling. Like I said. And will keep saying. Please remember what I say, I beg of you.
Moving on to EXCEPT:
SELECT
    c.*
FROM dbo.Comments AS c
WHERE c.UserId IS NULL
AND   c.Score > 2

EXCEPT

SELECT
    c.*
FROM dbo.Comments AS c
WHERE c.UserId IS NULL
AND   c.Score > 3
ORDER BY
    c.Score;
This will only return results from the “first” query (often referred to as the left, or outer query) with a Score of 3, because that’s the only data that exists in it that isn’t also in the “second” (or right, or inner) query.
Both queries will find many of the same rows after Score hits 2 or 3, but those get filtered out to show only the difference(s) between the two.
In case it wasn’t obvious, it’s a bit like using NOT EXISTS, in that rows are only checked, and not projected from the second/right/inner query, looking for Scores greater than 3.
Again, NULLs in the UserId column are handled just fine. No ISNULL/COALESCE/OR gymnastics required.
While no database platform adheres strictly or urgently to ANSI standards, waiting 20 years for an implementation in SQL Server is kind of really-extra-super-duper son-of-a-gun boy-howdy dag-nabbit-buster alright-bucko hold-your-horses listen-here-pal levels of irritating.
Think of all the useless, deprecated, and retired things we’ve gotten in the past 20 years instead of basic functionality. It’s infinitely miffing.
Anyway, I like these additions quite a lot. In many ways, these are extensions of INTERSECT and EXCEPT, because the workarounds involved for them involved those very directives. Sort of like Microsoft finally adding GREATEST and LEAST, after decades of developers wondering just what the hell to do instead, I hope they didn’t show up too late to keep SQL Server from being bullied by developers who are used to other platforms.
We can finally start to replace mutton-headed, ill-performing syntax like this:
SELECT
    c = COUNT_BIG(*)
FROM dbo.Users AS u
JOIN dbo.Posts AS p
  ON u.Id = p.LastEditorUserId
  OR (p.LastEditorUserId IS NULL);
With stuff that doesn’t suck, like this:
SELECT
    c = COUNT_BIG(*)
FROM dbo.Users AS u
JOIN dbo.Posts AS p
  ON u.Id IS NOT DISTINCT FROM p.LastEditorUserId;
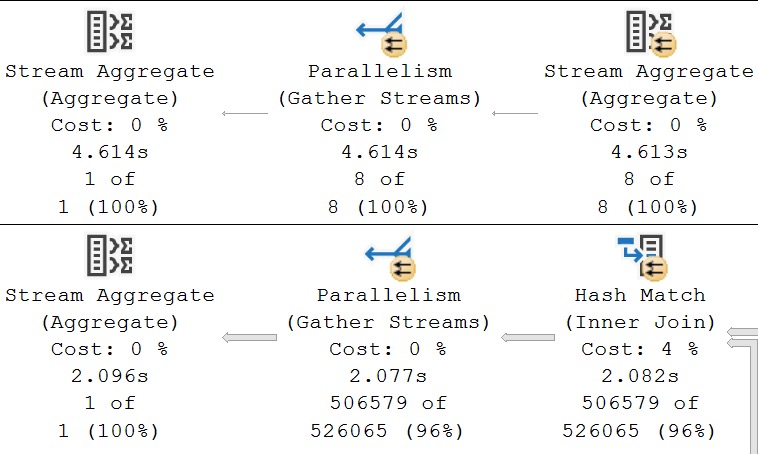
The query plan timings tell enough of a story here:
i’ve been waiting for so long
But not everyone is able to use the latest and greatest (or least and greatest, ha ha ha) syntax. And the newest syntax isn’t always better for performance, without additional tweaks.
And that’s okay with me. I do performance tuning for a living, and my job is to know all the available options and test them.
Like here. Like now.
The Only One I Know
Let’s compare these two queries. It’ll be fun, and if you don’t think it’s fun, that’s why you’ll pay me. Hopefully.
SELECT
    c = COUNT_BIG(*)
FROM dbo.Users AS u
JOIN dbo.Posts AS p
  ON u.Id IS NOT DISTINCT FROM p.LastEditorUserId;

SELECT
    c = COUNT_BIG(*)
FROM dbo.Users AS u
JOIN dbo.Posts AS p
  ON u.Id = p.LastEditorUserId
WHERE EXISTS
(
    SELECT p.LastEditorUserId FROM dbo.Posts AS p
    INTERSECT
    SELECT u.Id FROM dbo.Users AS u
);
Here’s the supporting index that I have for these queries:
CREATE INDEX
    LastEditorUserId
ON dbo.Posts
    (LastEditorUserId)
WITH
    (SORT_IN_TEMPDB = ON, DATA_COMPRESSION = PAGE);
It’s good enough. That’s what counts, I guess. Showing up.
20th Century Boy
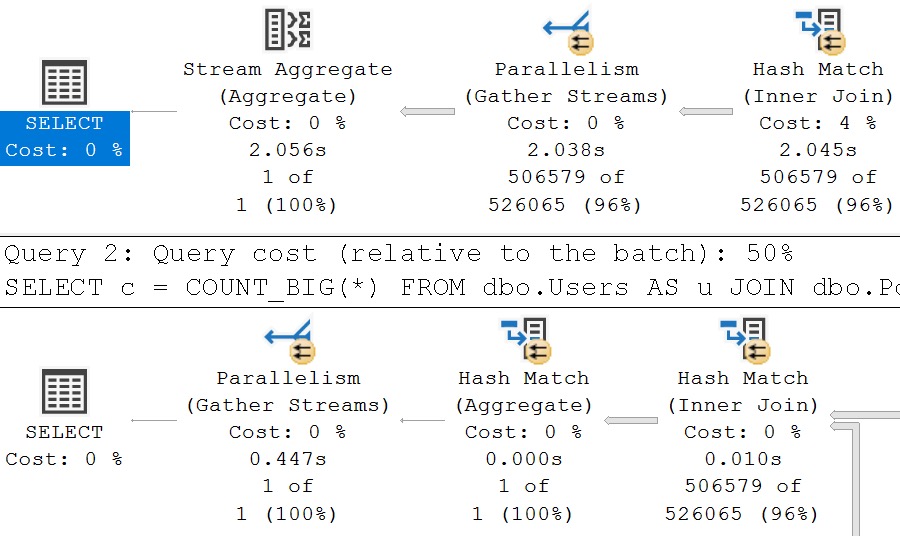
At first glance, many queries may appear to be quite astoundingly better. SQL Server has many tricks up its sleeves in newer versions, assuming that you’re ready to embrace higher compatibility levels, and pay through the nose for Enterprise Edition.
This is a great example. Looking at the final query timing, you might think that the new IS [NOT] DISTINCT FROM syntax is a real dumb dumb head.
gimme a second
But unless you’re invested in examining these types of things, you’ll miss subtle query plan difference, which is why you’ll pay me, hopefully,
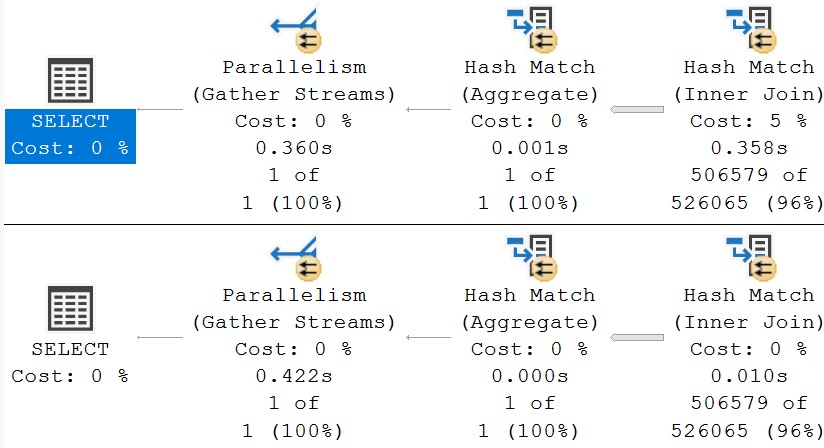
The second query receives the blessing of Batch Mode On Row Store, while the first does not. If we use the a helper object to get them both functioning on even terms, performance is quite close:
SELECT
    c = COUNT_BIG(*)
FROM dbo.Users AS u
JOIN dbo.Posts AS p
  ON u.Id IS NOT DISTINCT FROM p.LastEditorUserId
LEFT JOIN dbo.columnstore_helper AS ch
  ON 1 = 0;
i guess that’s okay
In this case, the slightly tweaked query just slightly edges out the older version of writing the query.
I Can’t Imagine The World Without Me
There are many ways to write a query, and examine the performance characteristics. As SQL Server adds more options, syntax, capabilities, and considerations, testing and judging them all (especially with various indexing strategies) becomes quite an endeavor.
I don’t blame developers for being unaware or, or unable to test a variety of different rewrites and scenarios. The level of understanding that it takes to tune many queries extends quite beyond common knowledge or sense.
The aim of these posts is to give developers a wider array of techniques, and a better understanding of what works and why, while exposing them to newer options available as upgrade cycles march bravely into the future.
Keeping up with SQL Server isn’t exactly a full time job. Things are changed and added from release to release, which are years apart.
But quite often I find companies full of people struggling to understand basic concepts, troubleshooting, and remediations that are nearly as old as patches for Y2K bugs.
My rates are reasonable, etc.
Thanks for reading!
Going Further
If this is the kind of SQL Server stuff you love learning about, you’ll love my training. I’m offering a 75% discount to my blog readers if you click from here. I’m also available for consulting if you just don’t have time for that, and need to solve database performance problems quickly. You can also get a quick, low cost health check with no phone time required.
UNION and UNION ALL seem to get used with the same lack of discretion and testing as several other things in T-SQL: CTEs vs temp tables, temp tables vs. table variables, etc.
There are many times I’ve seen developers use UNION when result sets have no chance of being non-unique anyway, and many times I’ve seen them use UNION ALL when there would be a great benefit to discarding unnecessary duplicates.
Even worse is when the whole query is written incorrectly in the first place, and both DISTINCT and UNION are dumped all over queries to account for unwanted results across the board.
For example, someone may test a query in isolation, decide that DISTINCT needs to be applied to that result set, and then use UNION when appending another set of results to the final query. Throw in the typical slew of NOLOCK hints and one is left to wonder if anyone even understands what correct output might look like at all.
The answer to most questions about the correct way to write a query of course hinge on the quality of the underlying data, and any observed flaws reported by end users or QA testers.
This all becomes quite difficult to wade through, because developers may understand the correct logic, but not the correct way to implement it.
Just An Onion
To start, let’s flesh out what each operator means in the most basic way.
Using a nifty SQL Server 2022 function, and the power of batch separator loops, we’re going to load the numbers 1-2 into two tables, twice.
CREATE TABLE
    #t1
(
    i integer
);

INSERT
    #t1 (i)
SELECT
    gs.*
FROM GENERATE_SERIES(1, 5) AS gs;
GO 2

CREATE TABLE
    #t2
(
    i integer
);

INSERT
    #t2 (i)
SELECT
    gs.*
FROM GENERATE_SERIES(1, 6) AS gs;
GO 2
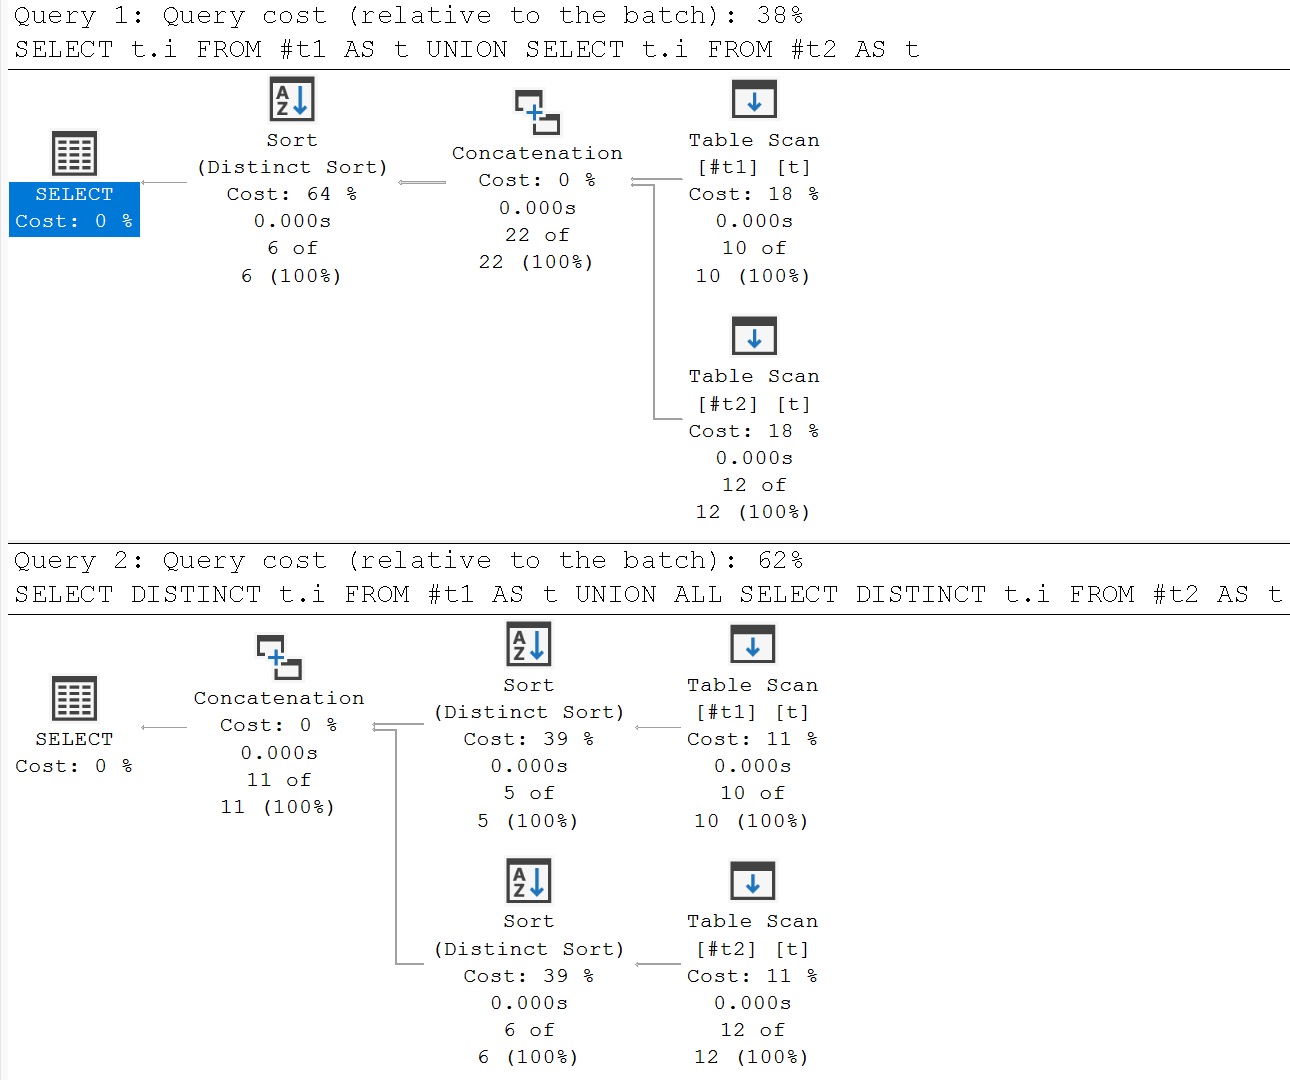
Doing this will provide a unique set of the numbers 1-6 from both temporary tables.
SELECT
    t.i
FROM #t1 AS t

UNION

SELECT
    t.i
FROM #t2 AS t;
Which is not logically equivalent to doing this:
SELECT DISTINCT
    t.i
FROM #t1 AS t

UNION ALL

SELECT DISTINCT
    t.i
FROM #t2 AS t;
The first query will not only deduplicate rows within each query, but also in the final result.
The second query will only deduplicate results from each query, but not from the final result.
To avoid playing word games with you, the first query will return the numbers 1-6 only once, and the second query will return 1-5 once, and 1-6 once.
Some additional sense can be made of the situation by looking at the query plans, and where the distinctness is applied.
soon
To put things plainly: if you’re already using UNION to bring to results together, there’s not a lot of sense in adding DISTINCT to each query.
Precedence, etc.
To better understand how UNION and UNION ALL are applied, I’d encourage you to use this simple example:
/*Changing these to UNION makes no difference*/
SELECT 1
UNION ALL
SELECT 2
UNION ALL
SELECT 3
/*Changing these to UNION makes a difference*/
UNION ALL
SELECT 1
UNION ALL
SELECT 2
UNION ALL
SELECT 3;
Specifically, look at the actual execution plans for these as you quote out ALL from the lines below the second comment.
You may even be surprised by what comes back when you get to the final UNION-ed select!
Orthodoxy
There has been quite a bit of performance debate about UNION and UNION ALL. Obviously, using UNION incurs some overhead to deduplicate results.
When you need it for result correctness, I’d encourage you to think about a few things:
The number of columns you’re selecting
The data types of the columns you’re selecting
What data actually identifies a unique row
I’ve come across many queries that were selecting quite a long list of columns, with lots of string data involved, that did a whole lot better using windowing functions over one, or a limited number of columns, with more manageable data types, to produce the desired results.
Here is a somewhat undramatic example:
DROP TABLE IF EXISTS
    #u1;

SELECT
    c.CreationDate,
    c.PostId,
    c.Score,
    c.Text,
    c.UserId
INTO #u1
FROM dbo.Comments AS c
WHERE c.Score IN (2, 9, 10)
AND   c.UserId IS NOT NULL

UNION

SELECT
    c.CreationDate,
    c.PostId,
    c.Score,
    c.Text,
    c.UserId
FROM dbo.Comments AS c
WHERE c.Score IN (3, 9, 10)
AND   c.UserId IS NOT NULL;

DROP TABLE IF EXISTS
    #u2;

SELECT
    y.CreationDate,
    y.PostId,
    y.Score,
    y.Text,
    y.UserId
INTO #u2
FROM
(

    SELECT
        x.*,
        n =
            ROW_NUMBER() OVER
            (
                PARTITION BY
                    x.UserId,
                    x.Score,
                    x.CreationDate,
                    x.PostId
                ORDER BY
                    x.UserId,
                    x.Score,
                    x.CreationDate,
                    x.PostId
            )
    FROM
    (
        SELECT
            c.CreationDate,
            c.PostId,
            c.Score,
            c.Text,
            c.UserId
        FROM dbo.Comments AS c
        WHERE c.Score IN (2, 9, 10)
        AND   c.UserId IS NOT NULL

        UNION ALL

        SELECT
            c.CreationDate,
            c.PostId,
            c.Score,
            c.Text,
            c.UserId
        FROM dbo.Comments AS c
        WHERE c.Score IN (3, 9, 10)
        AND   c.UserId IS NOT NULL
    ) AS x
) AS y
WHERE y.n = 1;
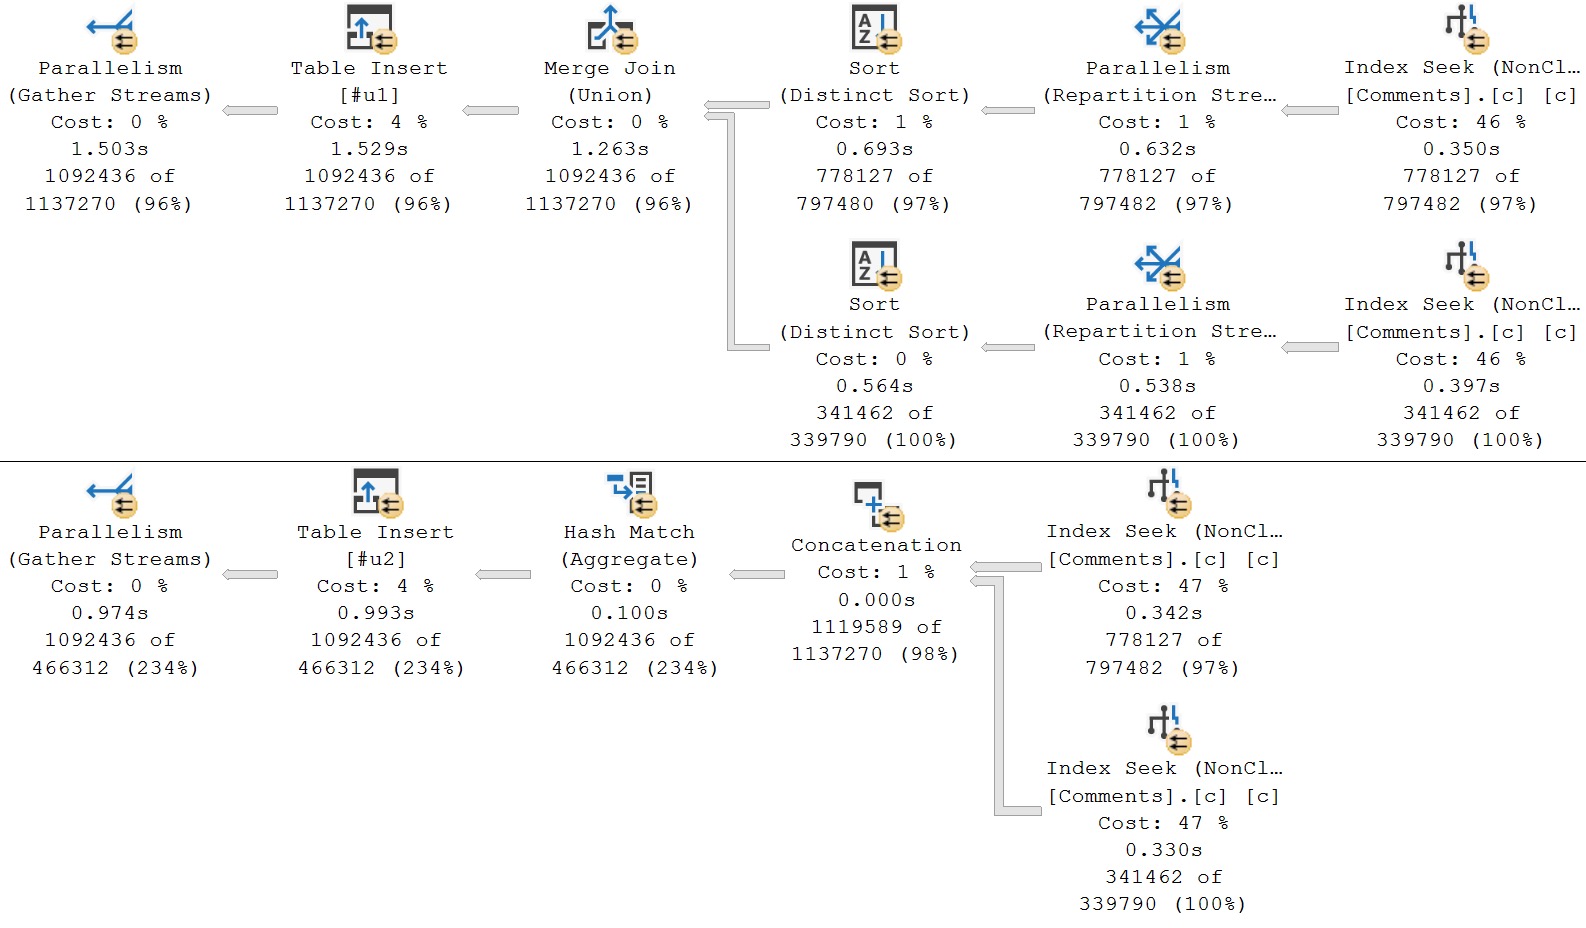
In the first query, we’re doing a straight union of all the columns in the Comments table, which includes the Text column (nvarchar 700).
In the second query, the UNION has been replaced by UNION ALL, and I’m using ROW_NUMBER on the non-text columns, and filtering to only the first result.
Here are the query plans:
wild times
If you’re looking at the second query plan and wondering why you’re not seeing the usual traces of windowing functions (window aggregates, or segment and sequence project, a filter operator to get n = 1), I’d highly suggest reading Undocumented Query Plans: The ANY Aggregate.
Like I said, this is a somewhat undramatic example. It only shaves about 500ms off the execution time, though that is technically about 30% faster in this scenario. It’s a good technique to keep in mind.
The index in place for these queries has this definition:
CREATE INDEX
    c
ON dbo.Comments
    (UserId, Score, CreationDate, PostId)
INCLUDE
    (Text)
WITH
    (SORT_IN_TEMPDB  = ON, DATA_COMPRESSION = PAGE);
Is UNION Ever Better Than UNION ALL?
There have been a number of times when producing distinct results has improved things rather dramatically, but there are a couple general characteristics they all shared:
Producing unique rows, either via UNION or DISTINCT is not prohibitively time consuming
The source being unique-ified feeds into an operation that is time consuming
Here’s an example:
CREATE INDEX
    not_badges
ON dbo.Badges
    (Name, UserId)
WITH
    (SORT_IN_TEMPDB = ON, DATA_COMPRESSION = PAGE);

CREATE INDEX
    not_posts
ON dbo.Posts
    (OwnerUserId)
INCLUDE
    (Score, PostTypeId)
WITH
    (SORT_IN_TEMPDB = ON, DATA_COMPRESSION = PAGE);
GO

DROP TABLE IF EXISTS
    #waypops;

CREATE TABLE
    #waypops
(
  UserId integer NOT NULL
);

INSERT
    #waypops WITH(TABLOCKX)
(
    UserId
)
SELECT
    b.UserId
FROM dbo.Badges AS b
WHERE b.Name IN
(
    N'Popular Question', N'Notable Question',
    N'Nice Question', N'Good Question',
    N'Famous Question', N'Favorite Question',
    N'Great Question', N'Stellar Question',
    N'Nice Answer', N'Good Answer', N'Great Answer'
);

SELECT
    wp.UserId,
    SummerHereSummerThere =
        SUM(ca.Score)
FROM #waypops AS wp
CROSS APPLY
(
    SELECT
        u.Score,
        ScoreOrder =
            ROW_NUMBER() OVER
            (
                ORDER BY
                    u.Score DESC
            )
    FROM
    (
        SELECT
            p.Score,
            p.OwnerUserId
        FROM dbo.Posts AS p
        WHERE p.OwnerUserId = wp.UserId
        AND   p.PostTypeId = 1

        UNION /*ALL*/

        SELECT
            p.Score,
            p.OwnerUserId
        FROM dbo.Posts AS p
        WHERE p.OwnerUserId = wp.UserId
        AND   p.PostTypeId = 2
    ) AS u
) AS ca
WHERE ca.ScoreOrder = 0
GROUP BY
    wp.UserId
ORDER BY
    wp.UserId;
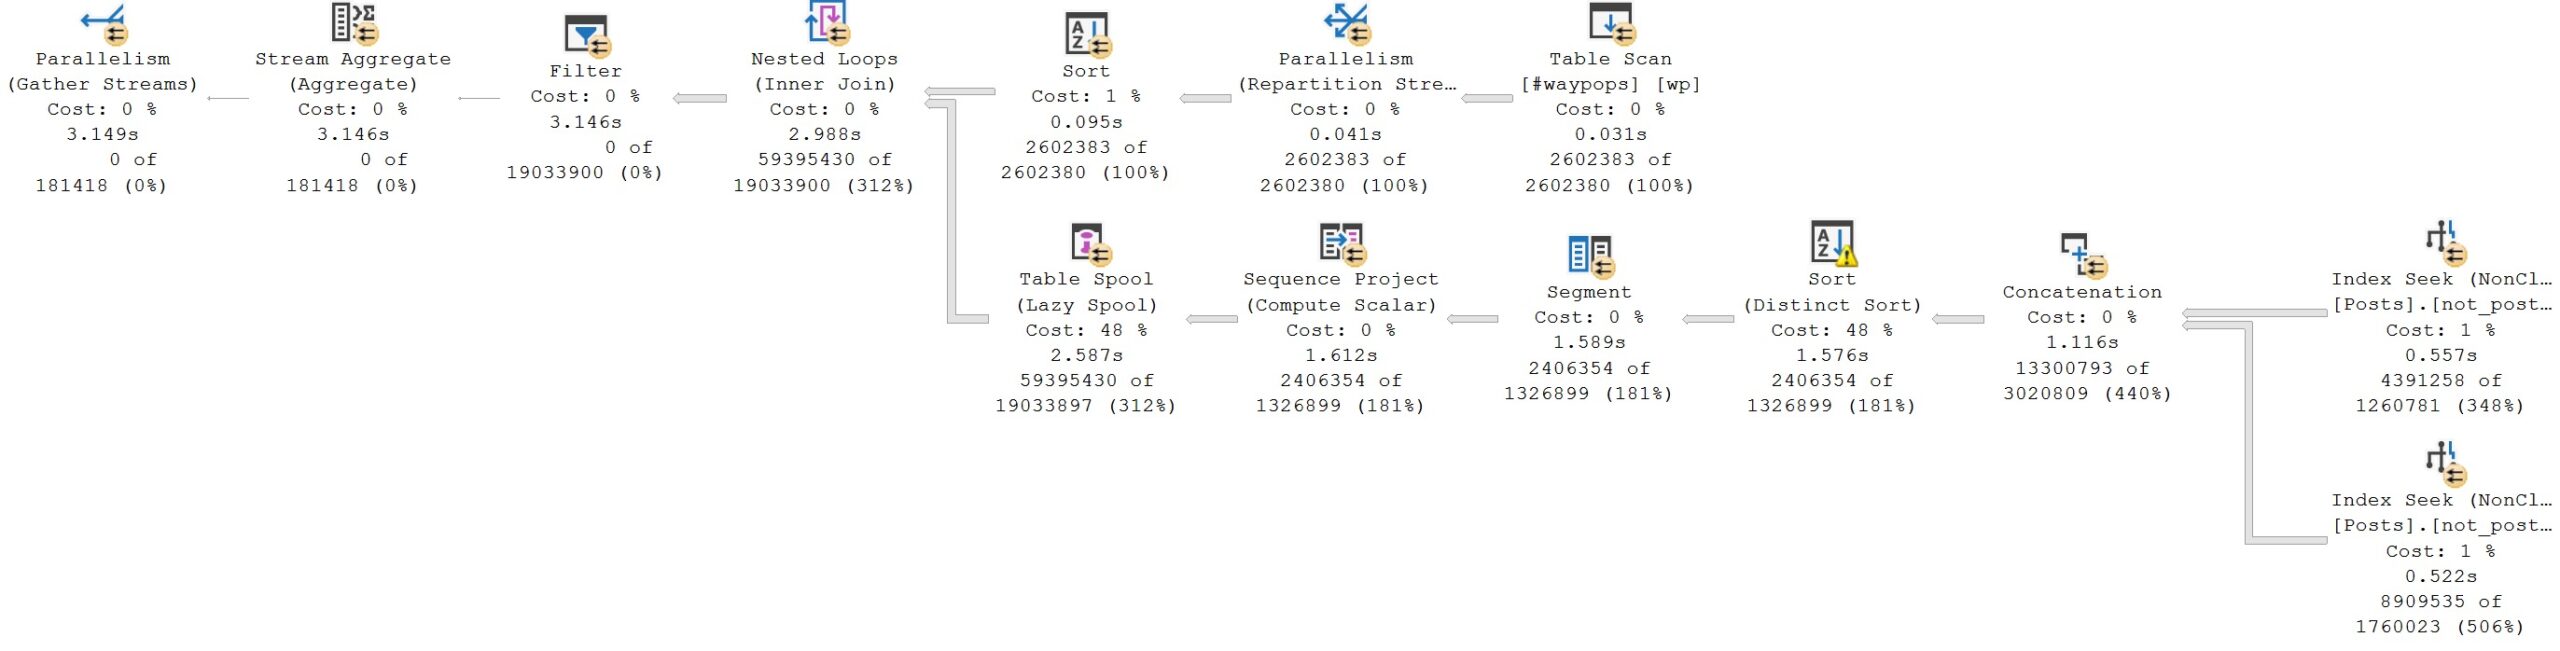
Executing this query as UNION-ed results gives us a query that finishes in about 3 seconds.
not bad!
Note that the Distinct Sort operator chosen to implement the desired results of the UNION reduces the rows from 13,300,793 to 2,406,354. This is especially important when Lazy Table Spools are involved.
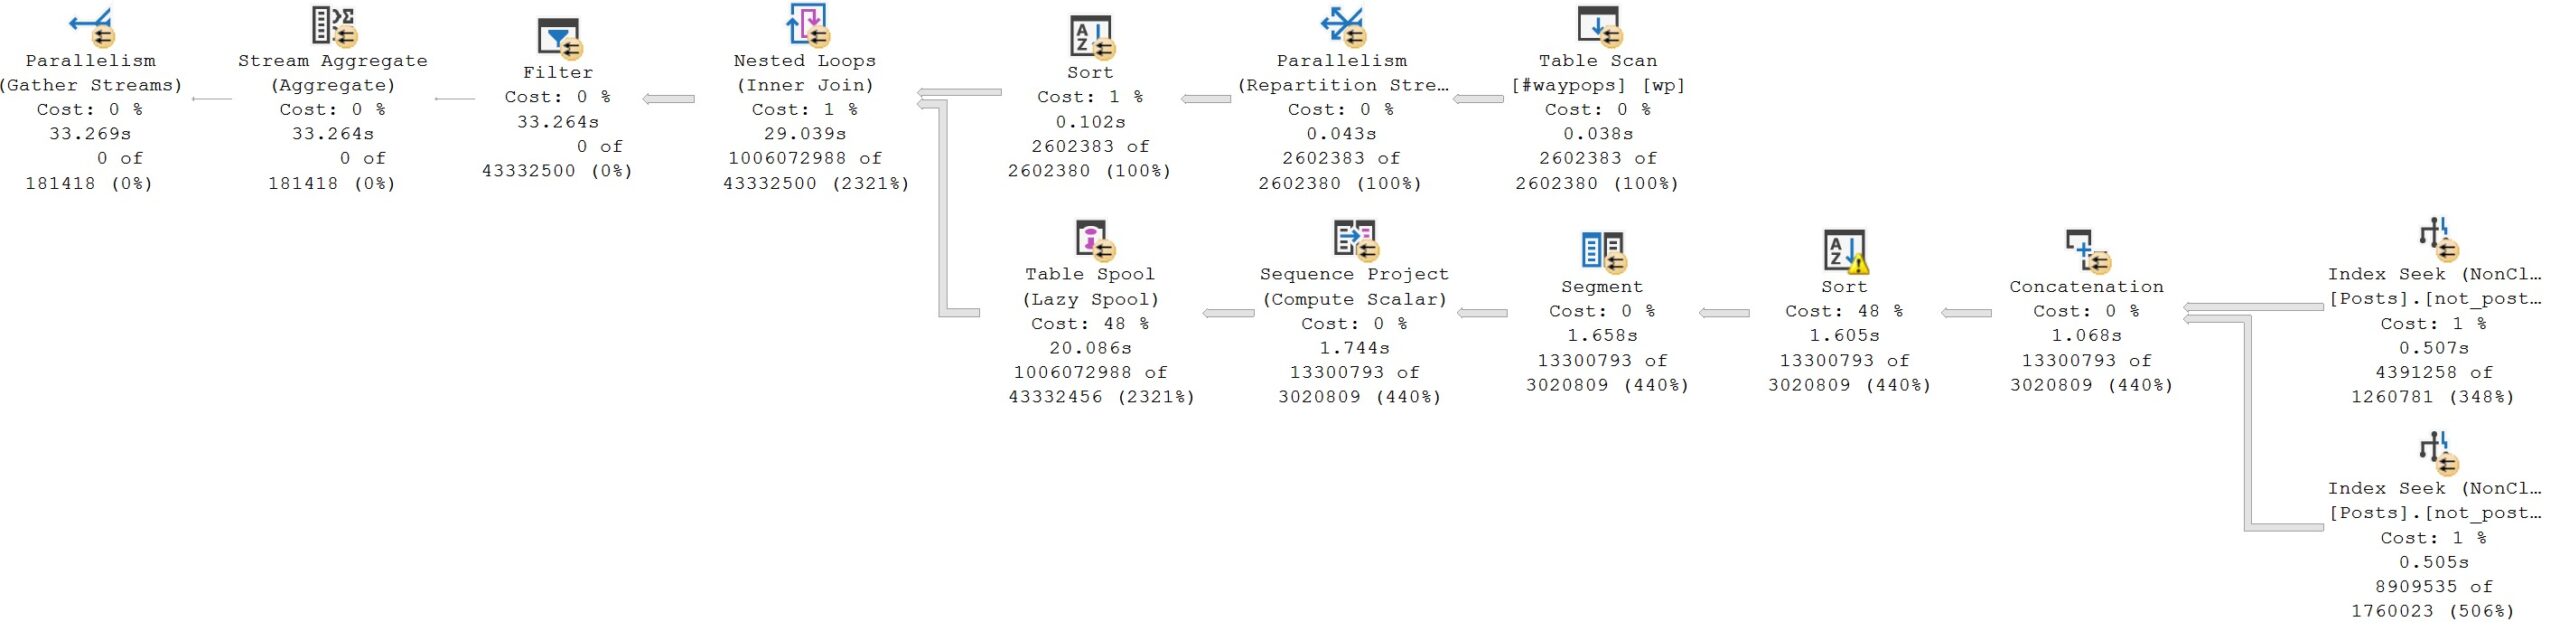
Here’s the query plan when it’s executed with UNION ALL:
bad!
Execution time goes from 3 seconds to 33 seconds. You may notice that the numbers on the inner side of the nested loops join are much larger across the plan, and that the Lazy Table Spool goes from about 900ms (2.587 seconds minus 1.612 seconds) to taking about 18 seconds (20 seconds minus 1.7 seconds). The Nested Loops Join also suffers rather dramatically, taking nearly 9 seconds, instead of the original 300ms, largely owing to the fact that it has to deal with 946,677,558 additional rows.
You’d suffer, too. Mightily.
Championship Belt
Choosing between UNION and UNION ALL is of course primarily driven by logical query correctness, but you should fully consider which columns actually identify a unique row for your query.
There are sometimes better ways of identifying uniqueness than comparing every single column being selected out in the final result set.
When you run into slow queries that are using UNION and UNION ALL, it’s usually worth investigating the overall usage, and if using one over the other gives you better performance along with correct results.
Where UNION can be particularly troublesome:
You’re selecting a lot of columns (especially strings)
You’re attempting to deduplicating many rows
You’re not working with a primary key
You’re not working with useful supporting indexes
Where UNION ALL can be particularly troublesome:
You’re selecting a lot of rows, and many duplicates exist in it
You’re sending those results into other operations, like joins (particularly nested loops)
You’re doing something computationally expensive on the results of the UNION ALL
Keep in mind that using UNION/UNION ALL is a generally better practice than writing some monolithic query with endless OR conditions in it.
Thanks for reading!
Going Further
If this is the kind of SQL Server stuff you love learning about, you’ll love my training. I’m offering a 75% discount to my blog readers if you click from here. I’m also available for consulting if you just don’t have time for that, and need to solve database performance problems quickly. You can also get a quick, low cost health check with no phone time required.
Whether you want to be the next great query tuning wizard, or you just need to learn how to start solving tough business problems at work, you need a solid understanding of not only what makes things fast, but also what makes them slow.
I work with consulting clients worldwide fixing complex SQL Server performance problems. I want to teach you how to do the same thing using the same troubleshooting tools and techniques I do.
I’m going to crack open my bag of tricks and show you exactly how I find which queries to tune, indexes to add, and changes to make. In this day long session, you’re going to learn about hardware, query rewrites that work, effective index design patterns, and more.
Before you get to the cutting edge, you need to have a good foundation. I’m going to teach you how to find and fix performance problems with confidence.
If this is the kind of SQL Server stuff you love learning about, you’ll love my training. I’m offering a 75% discount to my blog readers if you click from here. I’m also available for consulting if you just don’t have time for that, and need to solve database performance problems quickly. You can also get a quick, low cost health check with no phone time required.