Miss Leading
There are some oddities in the documentation for query store wait stats.
One is that RESOURCE_SEMAPHORE_QUERY_COMPILE is listed as a collected wait, but with an asterisk that says it’s not actually collected. I’ve tested workloads that generate lots of that wait, and just like the docs say, it doesn’t end up there.
Of course, since I added wait stats recently to sp_QuickieStore, I wanted to make sure other waits that I care about actually show up in there.
THREADPOOL Doesn’t
I ran a workload where 747 queries waited on THREADPOOL before running and completing.

But nothing shows up in query store wait stats. The stored procedure I ran to create the THREADPOOL waits shows up, and it has other waits — CPU and stuff — but nothing about workers. My guess why is because that’s a pre-compilation wait. When they pile up, there’s no execution context.
They’re quite not-figuratively spidless.
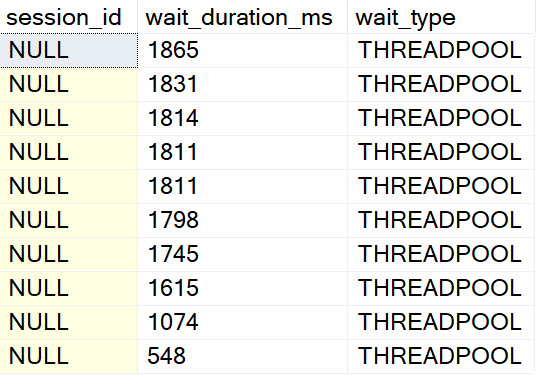
So, uh, I had to pull filtering for that wait out.
RESOURCE_SEMAPHORE Does
Running a similar workload, I can see where queries start to rack up RESOURCE_SEMAPHORE waits. At least, I’m pretty sure they do.
See, those waits are buried in a bunch of memory waits that are usually insignificant — and hell, on well-functioning server so is RESOURCE_SEMAPHORE — but I see the time spent on that, plus some other memory related waits.
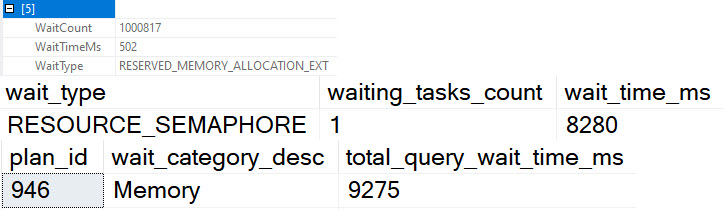
And that’s probably good enough for hand grenades.
Thanks for reading!
Going Further
If this is the kind of SQL Server stuff you love learning about, you’ll love my training. I’m offering a 75% discount to my blog readers if you click from here. I’m also available for consulting if you just don’t have time for that and need to solve performance problems quickly.