Smoking Ain’t Allowed In School
While working on my new training, part of what I want to show people is how to match what happens in a query plan to the type of wait stats they’ll see on their servers.
Take this query plan for example:
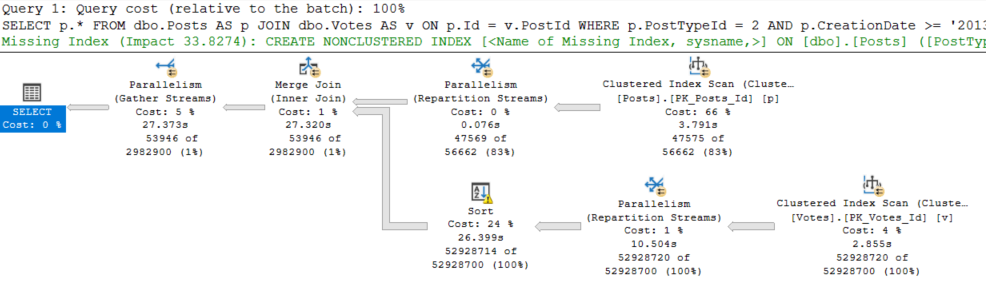
There are THINGS GOING ON HERE! Scans, parallelism, sorting, spilling.
What do the waits look like for this query?
Spy vs Spy
It’s fairly easy to focus in on what a session is doing using sys.dm_exec_session_wait_stats, though there are some caveats about when the numbers reset.
On my laptop, I can just open a new SSMS tab without worrying about connection pooling or any weird app stuff.
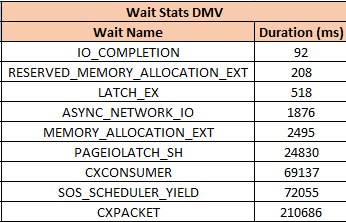
When I do, these are the waits I see while the query runs.
Every single one of those waits is accounted for by something that happened in the query plan (or its attributes).
Breakdown
Our pages weren’t in memory, so we read them from disk (PAGEIOLATCH_SH), we had to allocate buffer pool memory (MEMORY_ALLOCATION_EXT), we used parallelism (both CX waits), we needed memory to sort data (RESERVED_MEMORY_ALLOCATION_EXT), we didn’t get enough so we spilled (IO_COMPLETION), and we returned data to SSMS (ASYNC_NETWORK_IO).
LATCH_EX can be a lot of things. In a parallel plan, it can be associated with exchange buffers and the parallel page supplier.
The goal here is for you to both look at a server’s wait stats and come up with a mental image of the types of queries you’re going to see, and be able to tie query plan operators and attributes back to wait stats.
Thanks for reading!