Growler
Well over 500 years ago, Paul White wrote an article about distinct aggregates. Considering how often I see it while working with clients, and that Microsoft created column store indexes and batch mode rather than allow for hash join hints on CLR UDFs, the topic feels largely ignored.
But speaking of all that stuff, let’s look at how Batch Mode fixes multiple distinct aggregates.
Jumbo Size
A first consideration is around parallelism, since you don’t pay attention or click links, here’s a quote you won’t read from Paul’s article above:
Another limitation is that this spool does not support parallel scan for reading, so the optimizer is very unlikely to restart parallelism after the spool (or any of its replay streams).
In queries that operate on large data sets, the parallelism implications of the spool plan can be the most important cause of poor performance.
What does that mean for us? Let’s go look. For this demo, I’m using SQL Server 2019 with the compatibility level set to 140.
SELECT
   COUNT_BIG(DISTINCT v.PostId) AS PostId,
   COUNT_BIG(DISTINCT v.UserId) AS UserId,
   COUNT_BIG(DISTINCT v.BountyAmount) AS BountyAmount,
   COUNT_BIG(DISTINCT v.VoteTypeId) AS VoteTypeId,
   COUNT_BIG(DISTINCT v.CreationDate) AS CreationDate
FROM dbo.Votes AS v;
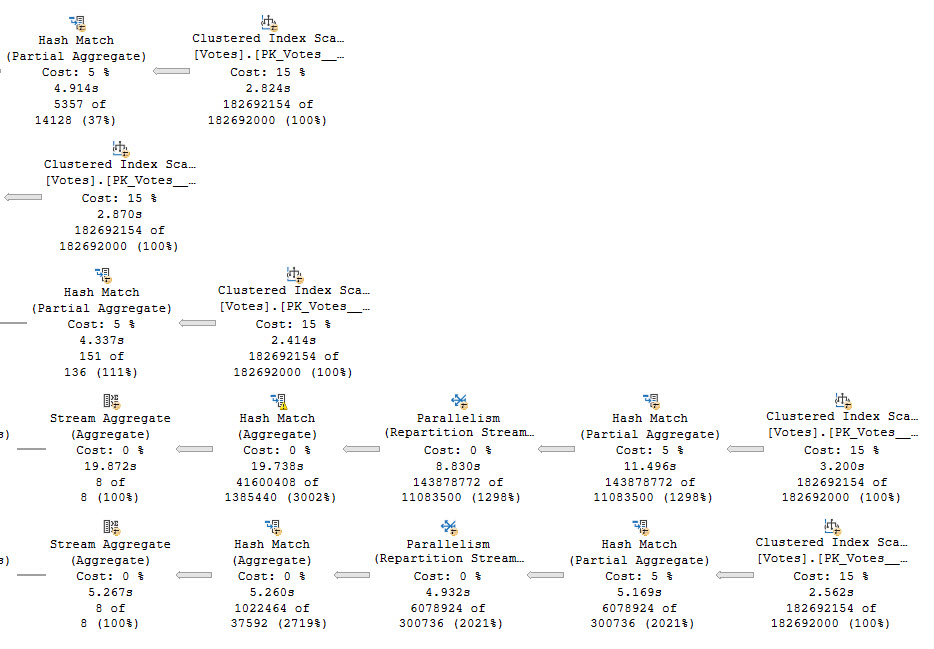
In the plan for this query, we scan the clustered index of the Votes table five times, or once per distinct aggregate.
In case you’re wondering, this results in one intent shared object lock on the Votes table.
<Object name="Votes" schema_name="dbo">
  <Locks>
    <Lock resource_type="OBJECT" request_mode="IS" request_status="GRANT" request_count="9" />
    <Lock resource_type="PAGE" page_type="*" index_name="PK_Votes__Id" request_mode="S" request_status="GRANT" request_count="14" />
  </Locks>
</Object>
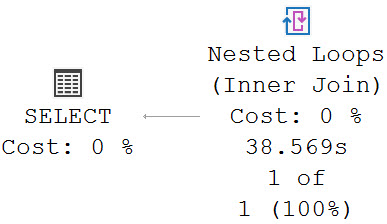
This query runs for 38.5 seconds, as the crow flies.
A Join Appears
Let’s join Votes to Posts for no apparent reason.
SELECT
   COUNT_BIG(DISTINCT v.PostId) AS PostId,
   COUNT_BIG(DISTINCT v.UserId) AS UserId,
   COUNT_BIG(DISTINCT v.BountyAmount) AS BountyAmount,
   COUNT_BIG(DISTINCT v.VoteTypeId) AS VoteTypeId,
   COUNT_BIG(DISTINCT v.CreationDate) AS CreationDate
FROM dbo.Votes AS v
JOIN dbo.Posts AS p
    ON p.Id = v.PostId;
The query plan now has two very distinct (ho ho ho) parts.
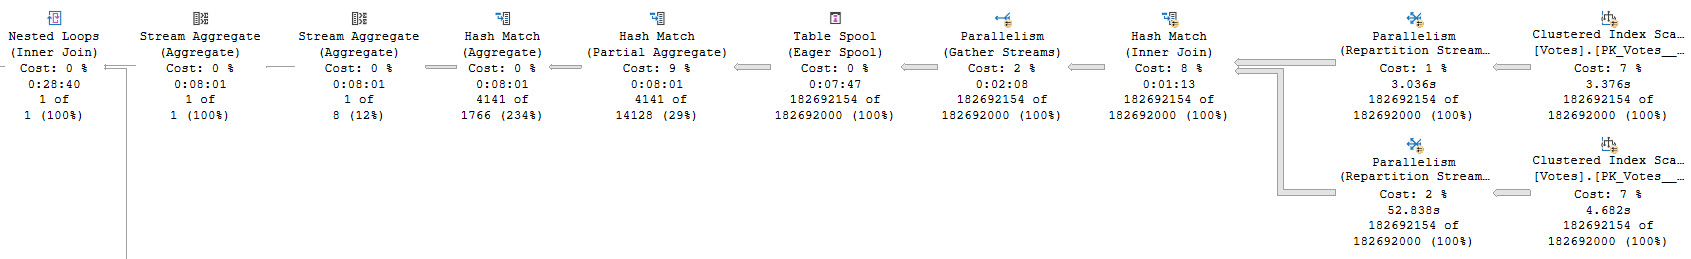
This is part 1. Part 1 is a spoiler. Ignoring that Repartition Streams is bizarre and Spools are indefensible blights, as we meander across the execution plan we find ourselves at a stream aggregate whose child operators have executed for 8 minutes, and then a nested loops join whose child operators have run for 20 minutes and 39 seconds. Let’s go look at that part of the plan.
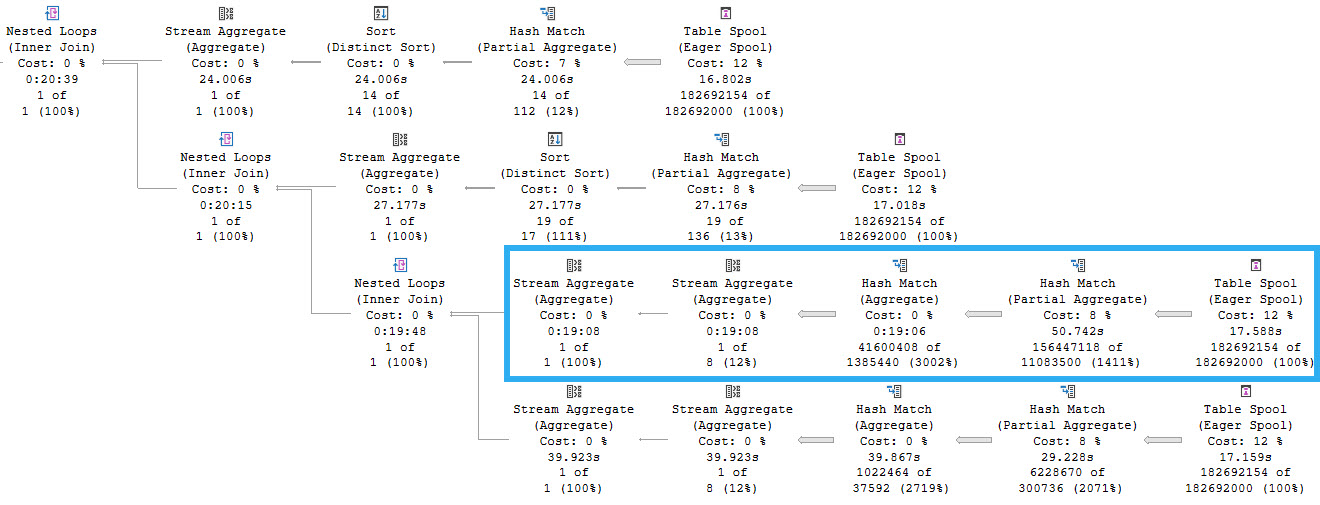
Each branch here represents reading from the same spool. We can tell this because the Spool operators do not have any child operators. They are starting points for the flow of data. One thing to note here is that there are four spools instead of five, and that’s because one of the five aggregates was processed in the first part of the query plan we looked at.
The highlighted branch is the one that accounts for the majority of the execution time, at 19 minutes, 8 seconds. This branch is responsible for aggregating the PostId column. Apparently a lack of distinct values is hard to process.
But why is this so much slower? The answer is parallelism, or a lack thereof. So, serialism. Remember the 500 year old quote from above?
Another limitation is that this spool does not support parallel scan for reading, so the optimizer is very unlikely to restart parallelism after the spool (or any of its replay streams).
In queries that operate on large data sets, the parallelism implications of the spool plan can be the most important cause of poor performance.
Processing that many rows on a single thread is painful across all of the operators.
Flounder Edition
With SQL Server 2019, we get Batch Mode On Row store when compatibility level gets bumped up to 150.
The result is just swell.
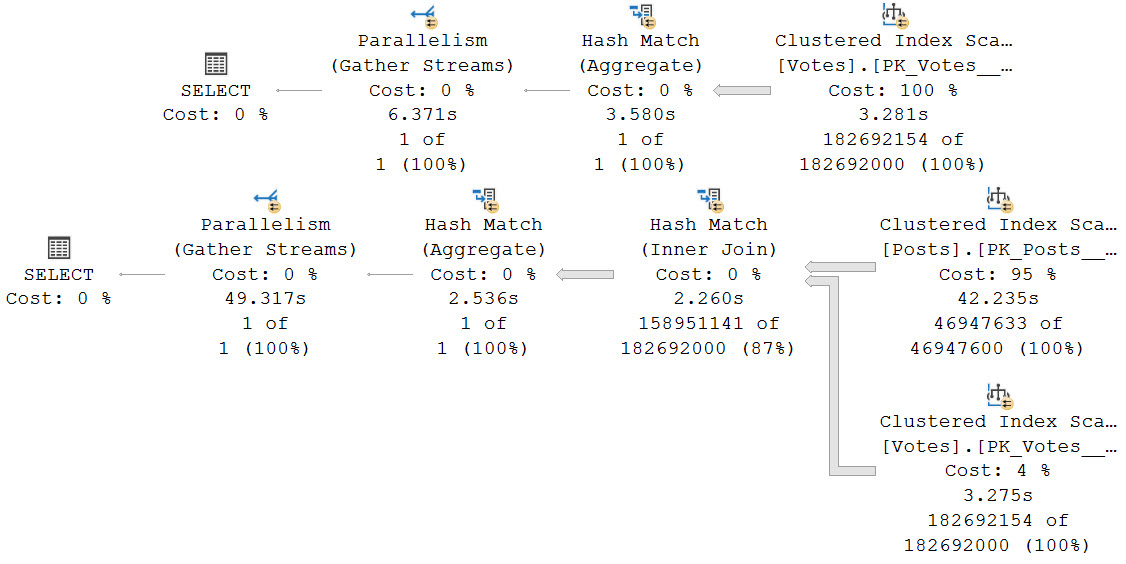
The second query with the join still runs for nearly a minute, but 42 seconds of the process is scanning that big ol’ Posts table.
Grumpy face.
Thanks for reading!
Going Further
If this is the kind of SQL Server stuff you love learning about, you’ll love my training. I’m offering a 75% discount to my blog readers if you click from here. I’m also available for consulting if you just don’t have time for that and need to solve performance problems quickly.
Related Posts
- Getting The Top Value Per Group With Multiple Conditions In SQL Server: Row Number vs. Cross Apply With MAX
- Getting The Top Value Per Group In SQL Server: Row Number vs. Cross Apply Performance
- Residual Predicates In SQL Server Query Plans
- SQL Server 2017 CU 30: The Real Story With SelOnSeqPrj Fixes
I wonder why table elimination doesn’t happen since we aren’t actually selecting anything form the Posts table though?
Because it’s an inner join that can eliminate rows.
Ohhhhhh yeah duh makes sense.