Shortness, Shortness
I use sp_HumanEvents to troubleshoot all sorts of SQL Server issues.
Most frequently, I used it to troubleshoot stored procedure performance like this:
EXEC sp_HumanEvents
    @event_type = 'query',
    @query_duration_ms = 5000,
    @session_id = N'60',
    @keep_alive = 1,
    @debug = 1;
The session it creates will have this definition:
CREATE EVENT SESSION keeper_HumanEvents_query
    ON SERVER
      ADD EVENT sqlserver.module_end
        (SET collect_statement = 1
         ACTION (sqlserver.database_name, sqlserver.sql_text, sqlserver.plan_handle, sqlserver.query_hash_signed, sqlserver.query_plan_hash_signed)
         WHERE (
            sqlserver.is_system = 0
     AND duration >= 5000000
     AND sqlserver.session_id = 60
 )),
      ADD EVENT sqlserver.rpc_completed
        (SET collect_statement = 1
         ACTION(sqlserver.database_name, sqlserver.sql_text, sqlserver.plan_handle, sqlserver.query_hash_signed, sqlserver.query_plan_hash_signed)
         WHERE (
            sqlserver.is_system = 0
     AND duration >= 5000000
     AND sqlserver.session_id = 60
 )),
      ADD EVENT sqlserver.sp_statement_completed
        (SET collect_object_name = 1, collect_statement = 1
         ACTION(sqlserver.database_name, sqlserver.sql_text, sqlserver.plan_handle, sqlserver.query_hash_signed, sqlserver.query_plan_hash_signed)
         WHERE (
            sqlserver.is_system = 0
     AND duration >= 5000000
     AND sqlserver.session_id = 60
 )),
      ADD EVENT sqlserver.sql_statement_completed
        (SET collect_statement = 1
         ACTION(sqlserver.database_name, sqlserver.sql_text, sqlserver.plan_handle, sqlserver.query_hash_signed, sqlserver.query_plan_hash_signed)
         WHERE (
            sqlserver.is_system = 0
     AND duration >= 5000000
     AND sqlserver.session_id = 60
 )),
      ADD EVENT sqlserver.query_post_execution_showplan
        (
         ACTION(sqlserver.database_name, sqlserver.sql_text, sqlserver.plan_handle, sqlserver.query_hash_signed, sqlserver.query_plan_hash_signed)
         WHERE (
            sqlserver.is_system = 0
     AND duration >= 5000000
     AND sqlserver.session_id = 60
 ))
I collect:
- module_end
- rpc_completed
- sp_statement_completed
- sql_statement_completed
- query_post_execution_showplan
Not all of them are relevant to stored procedure calls, but in larger contexts where I have no idea where long running queries might be coming from, it’s useful to get all these.
Weirdness, Weirdness
Where I find things getting somewhat annoying is when things start showing up in there that meet the duration filter, but don’t really give me anything further to go on.
To simulate what I mean, I’m going to use this stored procedure:
CREATE OR ALTER PROCEDURE
    dbo.Eventually
AS
BEGIN

    SET NOCOUNT, XACT_ABORT ON;

    WAITFOR DELAY '00:00:01.000';
    SELECT TOP (1) * FROM dbo.Badges AS b;
    WAITFOR DELAY '00:00:01.000';
    SELECT TOP (1) * FROM dbo.Comments AS c;
    WAITFOR DELAY '00:00:01.000';
    SELECT TOP (1) * FROM dbo.Posts AS p;
    WAITFOR DELAY '00:00:01.000';
    SELECT TOP (1) * FROM dbo.Users AS u;
    WAITFOR DELAY '00:00:01.000';
    SELECT TOP (1) * FROM dbo.Votes AS v;
    WAITFOR DELAY '00:00:01.000';

END;
GO

EXEC dbo.Eventually;
There are six waitfor commands that each pause for 1 second. In between them are queries that finish in milliseconds.
If I watch the event output, eventually, I’ll see this:
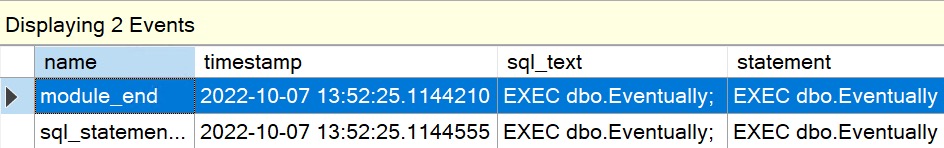
Okay, so the stored procedure took more than 5 seconds, but… no individual query took more than 5 seconds.
To troubleshoot further, I have to set the duration bar even lower, and then figure out what I can meaningfully tune.
- Do I have one query that takes four seconds
- Do I have ten queries that take 500 milliseconds
- Do I have 500 queries that take ten milliseconds
I see this behavior quite a bit with queries that loop/cursor over tons of data. They might take a whole bunch of rows and do a lot of really fast queries over them, but the time adds up.
There’s not really a good solution for this, either. The closer you look, by reducing the duration filter to lower and lower values, the more you return, the more overhead you cause, and the longer you have to wait for things to finish.
Sure, you can wring someone’s neck about not “thinking in sets”, but that doesn’t help when the processing takes place by passing looped values to stored procedures, unless you have the freedom to make significant app changes by using table valued parameters or something instead.
Thanks for reading!
Going Further
If this is the kind of SQL Server stuff you love learning about, you’ll love my training. I’m offering a 75% discount to my blog readers if you click from here. I’m also available for consulting if you just don’t have time for that, and need to solve database performance problems quickly. You can also get a quick, low cost health check with no phone time required.
One thought on “SQL Server Extended Event Duration Filtering Can Make Troubleshooting Frustrating”
Comments are closed.