Waiting Game
In SQL Server, troubleshooting blocking problems is a pain. It’s one of those things you really have to be monitoring for pretty actively in order to catch the full extent of it.
You might catch glimpses of it in sp_WhoIsActive or sp_BlitzWho, but it’s really hard to get the full picture and blocking chain for the duration of the event.
This is much easier done via dedicated monitoring tools, where the GUI will often give you a tree view of the blocking.
Does Query Store Help?
In SQL Server 2017, we got some high level wait stats associated with queries.
These are generally more helpful to identify which queries were being blocked, but still not who was doing the blocking.
Regular wait stats (i.e. from sys.dm_os_wait_stats) have no association to the queries that caused them.
If you’re on SQL Server 2017 or better, and you’re using Query Store, you can get a look at those waits with a query like this:
SELECT   qsws.wait_category_desc,
         SUM(qsws.total_query_wait_time_ms) / 1000. AS total_query_wait_time_s,
         AVG(qsws.avg_query_wait_time_ms) / 1000. AS avg_query_wait_time_s,
         MAX(qsws.max_query_wait_time_ms) / 1000. AS max_query_wait_time_s
FROM     sys.query_store_wait_stats AS qsws
GROUP BY qsws.wait_category_desc
ORDER BY total_query_wait_time_s DESC;
The view of your wait stats is far less detailed, but at least it’s only this one database. Look, at least you get that.
With that out of the way, let’s take that simple query and make a couple minor adjustments to get some other information out.
WITH qs_waits AS (
SELECT   qsws.wait_category_desc,
         qsws.plan_id,
         SUM(qsws.total_query_wait_time_ms) / 1000. AS total_query_wait_time_s,
         AVG(qsws.avg_query_wait_time_ms) / 1000. AS avg_query_wait_time_s,
         MAX(qsws.max_query_wait_time_ms) / 1000. AS max_query_wait_time_s
FROM     sys.query_store_wait_stats AS qsws
WHERE qsws.wait_category_desc = 'Lock'
GROUP BY qsws.wait_category_desc, qsws.plan_id
)
SELECT qsw.*,
       r.*,
       p.query_sql_text,
       TRY_CONVERT(XML, p.query_plan) AS query_plan
FROM qs_waits AS qsw
OUTER APPLY
(
    SELECT TOP (1) qsp.plan_id,
                   qsp.query_plan,
                   qsqt.query_sql_text
    FROM sys.query_store_plan AS qsp
    JOIN sys.query_store_query AS qsq
        ON qsq.query_id = qsp.query_id
    JOIN sys.query_store_query_text AS qsqt
        ON qsq.query_text_id = qsqt.query_text_id
    WHERE qsw.plan_id = qsp.plan_id
    ORDER BY qsp.last_execution_time DESC
) AS p
OUTER APPLY
(
    SELECT TOP (1) qsrs.avg_duration / 1000. AS avg_duration,
                   qsrs.avg_cpu_time / 1000. AS avg_cpu_time
    FROM sys.query_store_runtime_stats AS qsrs
    WHERE qsrs.plan_id = p.plan_id
    ORDER BY qsrs.last_execution_time DESC
) AS r;
There we go.
Nice, clean, simple, but most important totally intuitive. I love how easy it is to quickly get the information you want.
?
Lookin’ For Locks
That query will get information about queries which waited on Locks — that’s why we’re getting plan_id up in our CTE.
After that, we’re getting the plan and text of any queries that waited on locks, and a couple vanity metrics.

Only one query waited on locks. Make a couple notes here, though:
- avg_query_wait_time is 21 seconds
- avg_query_duration is 21 seconds
- avg_cpu_time is 0.12 seconds
My workload is Highly Contrived™ so the avg wait and query duration line up. In real life, you probably won’t have queries that were only ever waiting on locks to be released.
But it’s worth making some comparisons like this when you’re having blocking problems, especially when you tie wait times and durations in with cpu time.
If cpu is very low but duration is high, generally, you’ve found blocked queries.
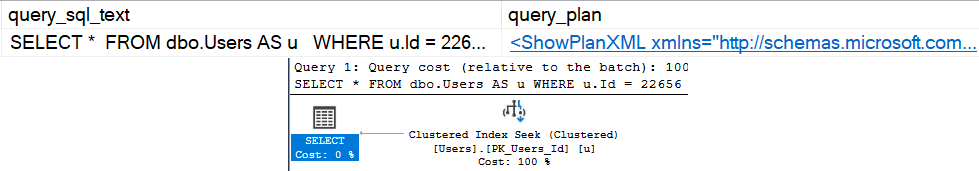
Looking at the text and plan, we can also reasonably surmise that this read query wasn’t blocking anything.
But Still…
This doesn’t tell us what query was blocking the select. If you want to figure that out, you’ve got some options:
- Log sp_WhoIsActive to a table on a schedule
- Use sp_HumanEvents to monitor for blocking
- Go buy a monitoring tool
Sure, you could also go digging through DMVs to find modification queries that last ran around the same time, but I’ve hit a lot of dead ends there.
A lot of this pain would go away if SQL Server were optimistic by default, or if you’re allowed to enable an optimistic isolation level.
And remember: Queries taking locks don’t register locking waits. Only queries being blocked register locking waits.
Thanks for reading!
Going Further
If this is the kind of SQL Server stuff you love learning about, you’ll love my training. I’m offering a 75% discount to my blog readers if you click from here. I’m also available for consulting if you just don’t have time for that and need to solve performance problems quickly.
Thanks for the discount on the course! Excited to watch it!
My pleasure! Always like to reward people who read until the end ?