Wait Stats During Exchange Spills In SQL Server Parallel Query Plans

Inorganic


Lots of people say these are rare — and perhaps they are becoming more so — but I still see them with some frequency. That’s not a terribly strong indictment of SQL Server, but that’s not the point of this blog or of my work.

Exchange spills are particularly interesting, and I’ve written about them a couple times:

For each query we run, we’re gonna execute the query, and then this query to look at session level wait stats.

SELECT
    desws.*
FROM sys.dm_exec_session_wait_stats AS desws
WHERE desws.session_id = @@SPID
ORDER BY desws.wait_time_ms DESC;

Turns Out


The first thing to understand here is that the memory grant itself doesn’t matter. That’s why there’s no hint for it on this query, as there have been in the others.

WITH 
    precheck AS 
(
    SELECT
        u.Id, 
        p.Id AS PostId,
        p.AcceptedAnswerId,
        n = 
            ROW_NUMBER() OVER
            (
                ORDER BY
            	    u.Id
            )
    FROM dbo.Users AS u
    JOIN dbo.Posts AS p
        ON p.OwnerUserId = u.Id
    WHERE  u.CreationDate > '20110825' 
    AND    u.Reputation > 100 
    AND    p.PostTypeId = 1
)
SELECT 
    u.*, 
    p.*
FROM precheck p
JOIN dbo.Users AS u
    ON p.Id = u.Id
WHERE ISNULL(p.n, u.Id) = 0
ORDER BY u.Id, u.Reputation
OPTION(USE HINT('ENABLE_PARALLEL_PLAN_PREFERENCE'), MERGE JOIN);

We do need to ask for a parallel merge join, because parallel merge joins were a mistake and should not have optimizer support.

Thanks for watching.

Back Brain


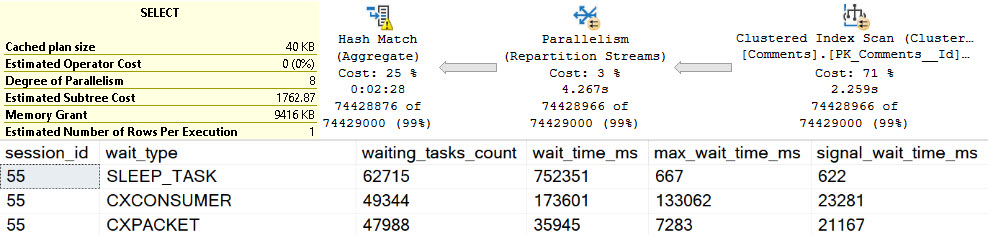
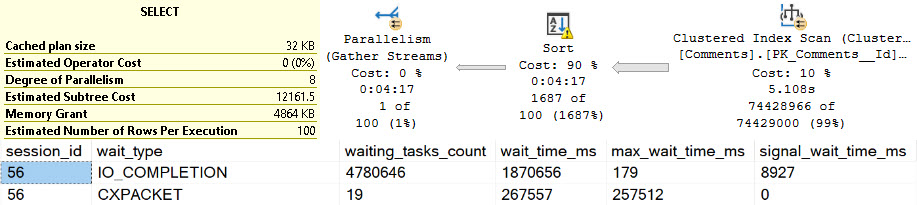
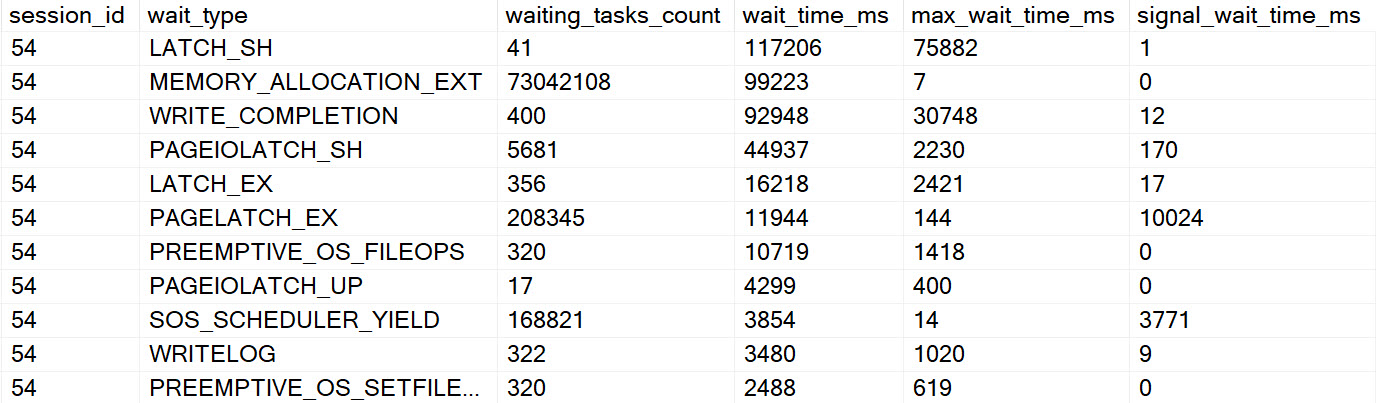
The waits here are interesting. At the top, we have perhaps high expected waits on parallelism, because the spills are encountered at parallel exchanges.

SQL Server Query Plan
ouch

There are quite high waits on PAGEIOLATCH_EX, SLEEP_TASK, and SLEEP_BPOOL_STEAL rounding out the top five. This is quite interesting, because I’ve never explicitly thought of PAGEIOLATCH_EX waits in the context of exchange spills. Normally, I think of them when queries read pages from disk into memory for modification.

Going down the line, SLEEP_TASK is familiar from our time spent with hash spills, but SLEEP_BPOOL_STEAL is so far undocumented anywhere.

One can make some inferences based on the name about what it might be doing, but… It could also be a bit of a catch-all wait, like other waits that can be generated by spills.

From Me


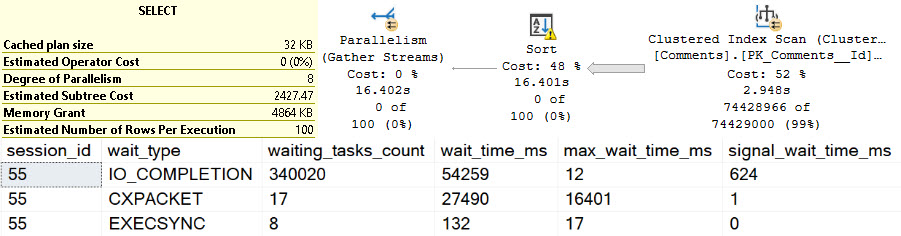
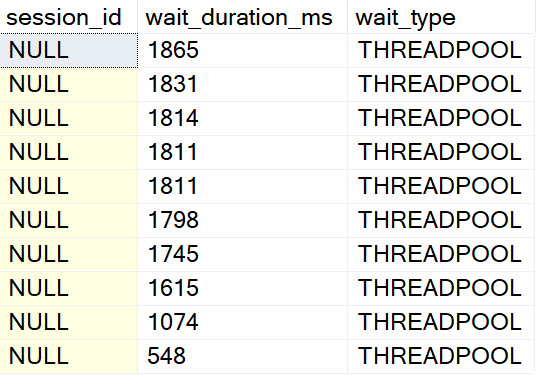
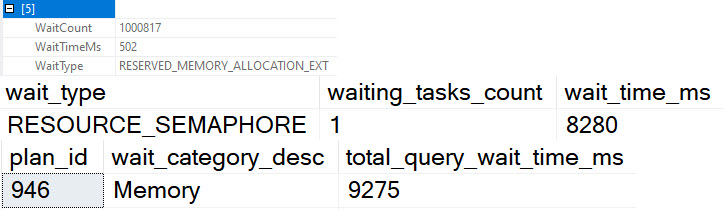
Going further, the other interesting waits encountered here look like so:

SQL Server Query Plan
fields

If I had a Magic Eight Ball out right now, it’d probably just go into convulsions. Perhaps SLEEP_TASK (shown one above) is another clear sign of a different kind of spill, but there’s so much else going on here it’s hard to tell for certain which waits this query generated were from the spill, and which were from other portions of the query executing regularly.

Points for hitting PREEMPTIVE waits, though.

To You


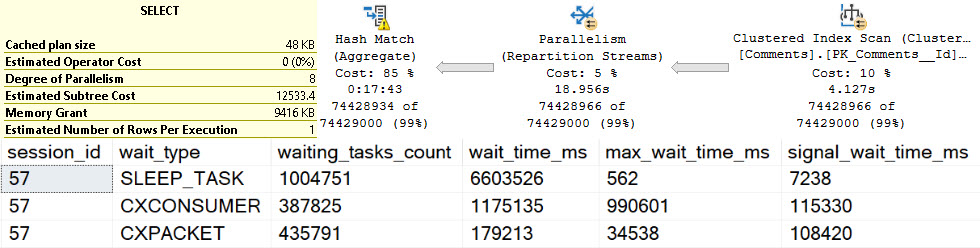
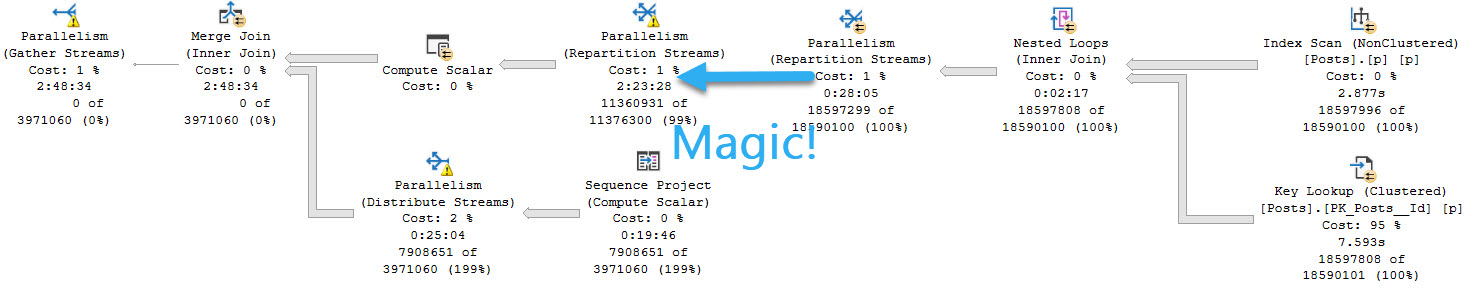
You weren’t mis-reading when you saw the query plan. This really did execute for over two hours. I tried to get another exchange spill into the mix by changing the query slightly, but all I got was a very cranky Repartition Streams.

WITH 
    precheck AS 
(
    SELECT
        u.Id, 
        p.Id AS PostId,
        p.AcceptedAnswerId,
        p.Body, --New
        n = 
            ROW_NUMBER() OVER
            (
                ORDER BY
            	    u.Id
            )
    FROM dbo.Users AS u
    JOIN dbo.Posts AS p WITH(INDEX = p)
        ON p.OwnerUserId = u.Id
    WHERE  u.CreationDate > '20110825' 
    AND    u.Reputation > 100 
    AND    p.PostTypeId = 1
)
SELECT 
    u.*, 
    p.*
FROM precheck p
JOIN dbo.Users AS u
    ON p.Id = u.Id
WHERE ISNULL(p.n, u.Id) = 0
ORDER BY u.Id, u.Reputation
OPTION(USE HINT('ENABLE_PARALLEL_PLAN_PREFERENCE'), MERGE JOIN);

And it ran for an extra 45 or so minutes, too.

SQL Server Query Plan
discard


Ugly Baby


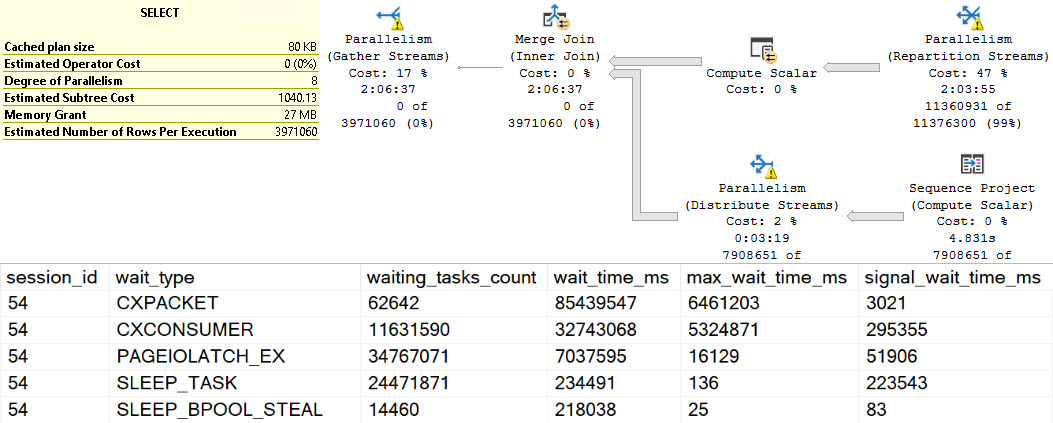
The results for this second query wait stats wise are just an amplified version of the original, of course.

SQL Server Wait Stats
gun tricks

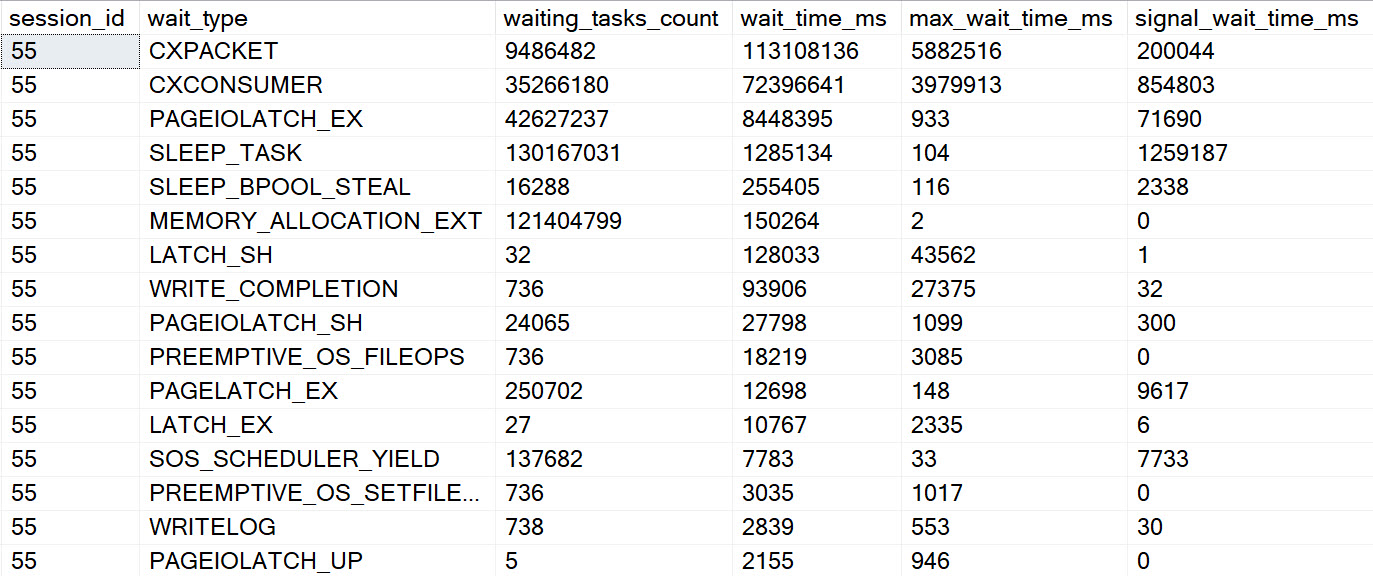
Obviously dragging the Body column around had a rather profound influence on things.

Whole And Wet


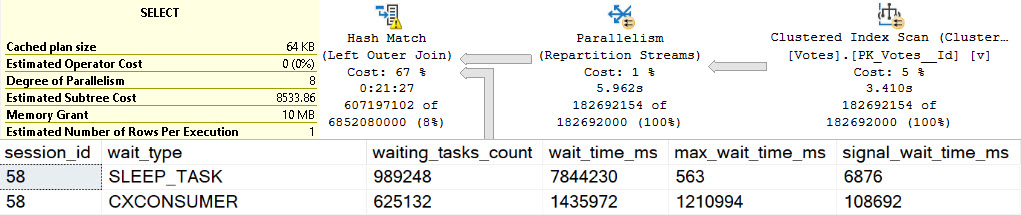
These waits are perhaps less obvious than other spills, though one could make reasonable assumptions about SLEEP_TASK waits here as well.

I’d be concerned about any query emitting high amounts of it, or any server with high amounts of it compared to uptime.

It seems unfortunate that there’s no wait directly tied to hash spills, but perhaps when we’re all living in some quantum batch mode reality in the cloud it won’t matter at all.

Thanks for reading!

Going Further


If this is the kind of SQL Server stuff you love learning about, you’ll love my training. I’m offering a 75% discount to my blog readers if you click from here. I’m also available for consulting if you just don’t have time for that and need to solve performance problems quickly.

Wait Stats During Hash Spills In SQL Server Query Plans

Jam Job


Hash spills are, as we’ll see, sometimes identified by a different wait than sort spills. In small quantities, spills are often not worth bothering with. But when they pile up, they can really cause some severe performance issues.

In this post, I want to show that both Hash Aggregates and Joins can cause the same wait type, along with some evidence that strings make things worse.

In all the queries, I’m going to be using the MAX_GRANT_PERCENT hint to set the memory grant ridiculously low, to make the waits I care about stick out.

For each query we run, we’re gonna execute the query, and then this query to look at session level wait stats.

SELECT
    desws.*
FROM sys.dm_exec_session_wait_stats AS desws
WHERE desws.session_id = @@SPID
ORDER BY desws.wait_time_ms DESC;

Merch Pants


First up, a highly doctored hash aggregate:

SELECT   
    c.CreationDate, 
    c.PostId, 
    c.Score, 
    c.UserId
FROM dbo.Comments AS c
GROUP BY 
    c.CreationDate, 
    c.PostId, 
    c.Score, 
    c.UserId
HAVING COUNT_BIG(*) > 2147483647 
OPTION(HASH GROUP, QUERYRULEOFF GenLGAgg, MAX_GRANT_PERCENT = 0.0);

But the important thing here is that there are no strings involved.

SQL Server Query Plan
clean

The spill goes on for about two minutes and twenty seconds, in row mode, at DOP 8.

That sure is bad, but in the words of Sticky Fingaz: Bu-bu-bu-but wait it gets worse.

Foolproof Plan


Let’s pull out another highly doctored hash aggregate, this time with our friend the Text column.

SELECT   
    c.CreationDate, 
    c.PostId, 
    c.Score, 
    c.Text, 
    c.UserId
FROM dbo.Comments AS c
GROUP BY 
    c.CreationDate, 
    c.PostId, 
    c.Score, 
    c.Text, 
    c.UserId
HAVING COUNT_BIG(*) > 2147483647 
OPTION(HASH GROUP, QUERYRULEOFF GenLGAgg, MAX_GRANT_PERCENT = 0.0);

We see more of our friend SLEEP_TASK. Again, many other things may add to this wait, but holy hoowee, this is hard to ignore.

SQL Server Query Plan
intro

That’s a solid — heck, let’s just call it 18 minutes — of spill time. That’s just plain upsetting.

Filthy.

And Join


Causing the same problem where a Hash Join is in play will exhibit the same wait.

SELECT 
    c.*
FROM dbo.Votes AS v
LEFT JOIN dbo.Comments AS c
    ON v.PostId = c.PostId
WHERE ISNULL(v.UserId, c.UserId) > 2147483647
OPTION(MAX_GRANT_PERCENT = 0.0);
SQL Server Query Plan
jacket, no shirt

Now we get stuck spilling for about 21 minutes, which is also awkward and uncomfortable.

Funkel


We’ve looked at sort spills being the cause of IO_COMPLETION waits, and hash spills being the cause of SLEEP_TASK waits.

Again, if you see a lot of these waits on your servers, you may want to check out the query here to find plans in the cache that are selects that cause writes, for reasons explained in the linked post.

Tomorrow we’ll wake up bright and early to look at which waits crop up during exchange spills.

Thanks for reading!

Going Further


If this is the kind of SQL Server stuff you love learning about, you’ll love my training. I’m offering a 75% discount to my blog readers if you click from here. I’m also available for consulting if you just don’t have time for that and need to solve performance problems quickly.

Wait Stats During Sort Spills In SQL Server Query Plans

Over Under


Over the next few days, I’m going to look at the wait stats that show up during different types of spills of different sizes. For no reason whatsoever, I’m going to start with sort spills. I’ll also cover hash and exchange spills, in case you were wondering just how long you’d have to sit here reading about them.

The point is not that spills are the sole things that cause these waits, it’s just to give you some things to potentially watch out for if you see these waits piling up and can’t pin down where they’re coming from.

In all the queries, I’m going to be using the MAX_GRANT_PERCENT hint to set the memory grant ridiculously low to make the waits I care about stick out.

For each query we run, we’re gonna execute the query, and then this query to look at session level wait stats.

SELECT
    desws.*
FROM sys.dm_exec_session_wait_stats AS desws
WHERE desws.session_id = @@SPID
ORDER BY desws.wait_time_ms DESC;

No Strings Attached


Strings are horrible. The bigger they are, they worse they are. Nearly every time I see oversized string columns, I see them causing problems.

File that under obvious foreshadowing while we look at a sort that doesn’t involve any strings.

SELECT 
    c.Id, 
    c.CreationDate, 
    c.PostId, 
    c.Score, 
    c.UserId
FROM 
(
    SELECT 
        c.Id, 
        c.CreationDate, 
        c.PostId, 
        c.Score, 
        c.UserId,
        n = 
            ROW_NUMBER() OVER 
            ( 
                ORDER BY 
                    c.PostId DESC 
            )
    FROM dbo.Comments AS c
) AS c
WHERE c.n = 0
OPTION(MAX_GRANT_PERCENT = 0.0);

This query executes at DOP 8 in row mode, and the primary wait that racks up is IO_COMPLETION.

SQL Server Query Plan
big hands

Strings Attached


Remember when I told you to file that thing up there under another thing? Here’s why.

In this query, we’re also going to select the Text column from the Comments table , which is an nvarchar(700).

SELECT 
    c.Id, 
    c.CreationDate, 
    c.PostId, 
    c.Score, 
    c.Text, --New
    c.UserId
FROM 
(
    SELECT 
        c.Id, 
        c.CreationDate, 
        c.PostId, 
        c.Score, 
        c.Text, --New
        c.UserId,
        n = 
            ROW_NUMBER() OVER 
            ( 
                ORDER BY 
                    c.PostId DESC 
            )
    FROM dbo.Comments AS c
) AS c
WHERE c.n = 0
OPTION(MAX_GRANT_PERCENT = 0.0);

In this case, things get way worse. If you’re surprised, you should try reading blog posts; particularly this one.

SQL Server Query Plan
a-heh-hem

Rather than ~16 seconds of spilling, we end up with a bit over four minutes of spilling. This is as the Mayans foretold, but the 2012 calendar was drunk and got the last two digits backwards.

Incomplete


Again, there are many potential causes of this wait, but on servers where I see them really piling up and ending up in top waits, there tends to be a dearth of memory and a lot of queries spilling to disk during sorts.

If you see this wait piling up, you may want to check out the query here to look for select queries that cause writes, which can indicate spills (among other things).

Thanks for reading!

Going Further


If this is the kind of SQL Server stuff you love learning about, you’ll love my training. I’m offering a 75% discount to my blog readers if you click from here. I’m also available for consulting if you just don’t have time for that and need to solve performance problems quickly.

Starting SQL: Sampling and Analyzing SQL Server Wait Stats With sp_BlitzFirst

I am a heading


Going Further


If this is the kind of SQL Server stuff you love learning about, you’ll love my training. I’m offering a 75% discount to my blog readers if you click from here. I’m also available for consulting if you just don’t have time for that and need to solve performance problems quickly.

Starting SQL: When Do SQL Server Queries Wait, And What Are They Waiting On?

Starting SQL: When Do Queries Wait?


Going Further


If this is the kind of SQL Server stuff you love learning about, you’ll love my training. I’m offering a 75% discount to my blog readers if you click from here. I’m also available for consulting if you just don’t have time for that and need to solve performance problems quickly.

Starting SQL: Interesting Things About Wait Stats In SQL Server

Starting SQL: Interesting Things About Waits


Going Further


If this is the kind of SQL Server stuff you love learning about, you’ll love my training. I’m offering a 75% discount to my blog readers if you click from here. I’m also available for consulting if you just don’t have time for that and need to solve performance problems quickly.

sp_QuickieStore: Searching For Wait Stats

Money Money


Going Further


If this is the kind of SQL Server stuff you love learning about, you’ll love my training. I’m offering a 75% discount to my blog readers if you click from here. I’m also available for consulting if you just don’t have time for that and need to solve performance problems quickly.

No THREADPOOL Waits In Query Store

Yep Nope


Going Further


If this is the kind of SQL Server stuff you love learning about, you’ll love my training. I’m offering a 75% discount to my blog readers if you click from here. I’m also available for consulting if you just don’t have time for that and need to solve performance problems quickly.

Wait Stats SQL Server’s Query Store Doesn’t Actually Track

Miss Leading


There are some oddities in the documentation for query store wait stats.

One is that RESOURCE_SEMAPHORE_QUERY_COMPILE is listed as a collected wait, but with an asterisk that says it’s not actually collected. I’ve tested workloads that generate lots of that wait, and just like the docs say, it doesn’t end up there.

Of course, since I added wait stats recently to sp_QuickieStore, I wanted to make sure other waits that I care about actually show up in there.

THREADPOOL Doesn’t


I ran a workload where 747 queries waited on THREADPOOL before running and completing.

THREADPOOL
el threado

But nothing shows up in query store wait stats. The stored procedure I ran to create the THREADPOOL waits shows up, and it has other waits — CPU and stuff — but nothing about workers. My guess why is because that’s a pre-compilation wait. When they pile up, there’s no execution context.

They’re quite not-figuratively spidless.

THREADPOOL
lezz than zero

So, uh, I had to pull filtering for that wait out.

RESOURCE_SEMAPHORE Does


Running a similar workload, I can see where queries start to rack up RESOURCE_SEMAPHORE waits. At least, I’m pretty sure they do.

See, those waits are buried in a bunch of memory waits that are usually insignificant — and hell, on well-functioning server so is RESOURCE_SEMAPHORE — but I see the time spent on that, plus some other memory related waits.

RESOURCE_SEMAPHORE
carry the um

And that’s probably good enough for hand grenades.

Thanks for reading!

Going Further


If this is the kind of SQL Server stuff you love learning about, you’ll love my training. I’m offering a 75% discount to my blog readers if you click from here. I’m also available for consulting if you just don’t have time for that and need to solve performance problems quickly.

The Three Kinds Of Memory Contention In SQL Server

Savings and Loans


Whomever decided to give “memory bank” its moniker was wise beyond their years, or maybe they just made a very apt observation: all memory is on loan.

Even in the context we’ll be talking about, when SQL Server has lock pages in memory enabled, the pages that are locked in memory may not have permanent residency.

If your SQL Server doesn’t have enough memory, or if various workload elements are untuned, you may hit one of these scenarios:

  • Query Memory Grant contention (RESOURCE_SEMAPHORE)
  • Buffer Cache contention (PAGEIOLATCH_XX)
  • A mix of the two, where both are fighting over finite resources

It’s probably fair to note that not all query memory grant contention will result in RESOURCE_SEMAPHORE. There are times when you’ll have just enough queries asking for memory grants to knock a significant pages out of the plan cache to cause an over-reliance on disk without ever hitting the point where you’ve exhausted the amount of memory that SQL Server will loan out to queries.

To help you track down any of these scenarios, you can use my stored procedure sp_PressureDetector to see what’s going on with things.

Black Friday


Most servers I see have a mix of the two issues. Everyone complains about SQL Server being a memory hog without really understanding why. Likewise, many people are very proud about how fast their storage is without really understanding how much faster memory is. It’s quite common to hear someone say they they recently got a whole bunch of brand new shiny flashy storage but performance is still terrible on their server with 64GB of RAM and 1TB of data.

I recently had a client migrate some infrastructure to the cloud, and they were complaining about how queries got 3x slower. As it turned out, the queries were accruing 3x more PAGEIOLATCH waits with the same amount of memory assigned to SQL Server. Go figure.

If you’d like to see those waits in action, and how sp_PressureDetector can help you figure out which queries are causing problems, check out this video.

Market Economy


The primary driver of how much memory you need is how much control you have over the database. The less control you have, the more memory you need.

Here’s an example: One thing that steals control from you is using an ORM. When you let one translate code into queries, Really Bad Things™ can happen. Even with Perfect Indexes™ available, you can get some very strange queries and subsequently very strange query plans.

One of the best ways to take some control back isn’t even available in Standard Edition.

If you do have control, the primary drivers of how much memory you need are how effective your indexes are, and how well your queries are written to take advantage of them. You can get away with less memory in general because your data footprint in the buffer pool will be a lot smaller.

You can watch a video I recorded about that here:

Thanks for reading (and watching)!

Going Further


If this is the kind of SQL Server stuff you love learning about, you’ll love my training. I’m offering a 75% discount to my blog readers if you click from here. I’m also available for consulting if you just don’t have time for that and need to solve performance problems quickly.