Understand Your Plan: Missing Index Requests

Just A Friend


Missing index requests aren’t perfect, and that’s okay. But you need to know where they’re not okay so you can start creating better ones.

Let’s start with some basics:

  • They really only care about the where clause
  • Joins always seem to end up in the INCLUDE list
  • Column suggestions are not in any particular order
    • Outside of being grouped into equality and inequality predicates
  • The impact is based on operator costs, which is often complete crap

There’s more, but this is a good start. Good starts are good. Nice things are nice.

And of course, the day this blog published, Microsoft published a huge update to missing index docs, by way of the fabulous Kendra Little.

Let’s move on.

Users


The Users table looks like this. It’s important for me to show you this up front, because column ordinal position in the table is important for understanding missing index requests.

SQL Server Query Plan
what-whatcha need?

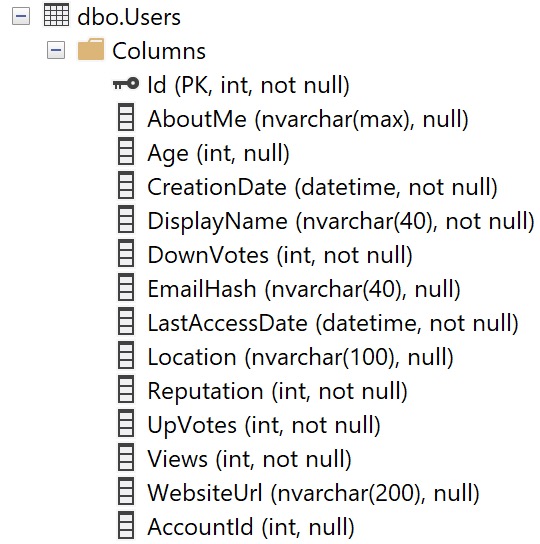
Keep this in mind — the columns aren’t in alphabetical order, or how selective they are, or by data type, etc.

They’re in the order that they are when the table was created, and then if any of them were added later on.

That’s all.

Long Time


Let’s take this query:

SELECT TOP (10000)
    u.Id,
    u.AccountId,
    u.DisplayName,
    u.Reputation,
    u.Views,
    u.CreationDate
FROM dbo.Users AS u
WHERE u.Views = 0
ORDER BY u.CreationDate DESC;

Is it very useful? No. But it’ll help us paint the right picture. The query plan doesn’t matter, because it’s just a clustered index scan, and it’ll be a clustered index scan for every other permutation, too.

The missing index for this query is like so:

CREATE NONCLUSTERED INDEX [<Name of Missing Index, sysname,>]
ON [dbo].[Users] ([Views])
INCLUDE ([CreationDate],[DisplayName],[Reputation],[AccountId])

Only the Views column is in the key of the index, even though CreationDate is an order by column.

In this case, it would be beneficial to have it as the second key column, because it would be sorted for free for us after an equality predicate.

You may also notice that Id is not part of the definition too. That’s because it’s the clustered index, so it will be inherited by any nonclustered indexes we create.

Normal


Okay, now let’s look at this query, with a slightly different where clause:

SELECT TOP (10000)
    u.Id,
    u.AccountId,
    u.DisplayName,
    u.Reputation,
    u.Views,
    u.CreationDate
FROM dbo.Users AS u
WHERE u.Views = 0
AND   u.Reputation = 1
ORDER BY u.CreationDate DESC;

We’re adding another predicate on Reputation = 1 here. The missing index request now looks like this:

CREATE NONCLUSTERED INDEX [<Name of Missing Index, sysname,>]
ON [dbo].[Users] ([Reputation],[Views])
INCLUDE ([CreationDate],[DisplayName],[AccountId])

Neither one of these predicates is particularly selective (7,954,119 and 6,197,417, respectively) but Reputation ends up first in the key column list because its ordinal position in the table is first.

Frequency


How about if we add a really selective predicate to our query?

SELECT TOP (10000)
    u.Id,
    u.AccountId,
    u.DisplayName,
    u.Reputation,
    u.Views,
    u.CreationDate
FROM dbo.Users AS u
WHERE u.AccountId = 12462842
AND   u.Views = 0
ORDER BY u.CreationDate DESC;

Now our missing index request looks like this:

CREATE NONCLUSTERED INDEX [<Name of Missing Index, sysname,>]
ON [dbo].[Users] ([Views],[AccountId])

Two things happened:

  • We don’t have any included columns anymore
  • AccountId is second in the key columns

This is amusing because the missing index request machine seems to understand that this will only ever one row via the equality predicate on AccountId but it still gets enumerated as the second index key column.

In other words, it doesn’t put the most selective column first. It gives you an index designed, like other examples, based on the column’s ordinal position in the table.

Nothing else, at least not so far.

Inequality


Where missing index requests will change column order is when it comes to inequality predicates. That doesn’t just mean not equal to, oh no no no.

That covers any “range” predicate: <, <=, >, >=, <> or !=, and IS NOT NULL.

Take this query for example:

SELECT TOP (10000)
    u.Id,
    u.AccountId,
    u.DisplayName,
    u.Reputation,
    u.Views,
    u.CreationDate
FROM dbo.Users AS u
WHERE u.AccountId = 0
AND   u.Reputation < 0
AND   u.Views < 0
ORDER BY u.CreationDate DESC;

The missing index request looks like this:

CREATE NONCLUSTERED INDEX [<Name of Missing Index, sysname,>]
ON [dbo].[Users] ([AccountId],[Reputation],[Views])

Now AccountId is the leading key column, but Reputation and Views are still in ordinal position order as inequality predicates.

Wink Wink


Now, look, I started off by saying that missing index requests aren’t perfect, and that’s okay. They’re not meant to replace a well-trained person. They’re meant to help the hapless when it comes to fixing slow queries.

As you get more comfortable with indexes and how to create them to make queries go faster, you’ll start to see deficiencies in missing index requests.

But you don’t want the optimizer spending a long time in the index matching/missing index request phases. That’s a bad use of its time.

As you progress, you’ll start treating missing index requests like a crying baby: something might need attention, but it’s up to you as an adult DBA or developer to figure out what that is.

Thanks for reading!

Going Further


If this is the kind of SQL Server stuff you love learning about, you’ll love my training. I’m offering a 75% discount to my blog readers if you click from here. I’m also available for consulting if you just don’t have time for that and need to solve performance problems quickly.

Understand Your Plan: Costs (And Why You Shouldn’t Bother With Them)

Goodfor


Costs are okay for figuring out why SQL Server’s cost-based optimizer:

  • Chose a particular query plan
  • Chose a particular operator

Costs are not okay for figuring out:

  • Which queries are the slowest
  • Which queries you should tune first
  • Which missing index requests are the most important
  • Which part of a query plan was the slowest

But a lot of you believe in memes like this, which leads to my ongoing employment, so I’m not gonna try to wrestle you too hard on this.

Keep on shooting those “high cost” queries down that are part of some overnight process no one cares about while the rest of your server burns down.

I’ll wait.

Badfor


In a lot of the query tuning work I do, plan and operator costs don’t accurately reflect what’s a problem, or what’s the slowest.

Here’s an example, from a fairly large query plan, where the operator times show nearly all the execution time in a branch full of operators where the costs aren’t particularly high.

The plan runs for ~5 seconds in total.

SQL Server Query Plan
onion

Would you suspect this branch is where ~4 of those seconds is spent? What are you gonna tune with an index seek? You people love seeks.

I’ll wait.

Time Spent


Where queries spend the most time in a plan is where you need to focus your query tuning efforts. Stop wasting time with things like costs and reads and whatnot.

If you want a good list of things not to do while troubleshooting a query, start with the bullet points in this Microsoft support blog:

  • Update the statistics and rebuild the indexes.

  • Use Recompile or MAXDOP, grant memory hint

  • Use the latest compatibility model

  • Clear buffer pool.

  • Clear procedure cache.

  • Comparing the same automatic statistics, comparing rows, etc..

  • Plan guides.

Get the query. Get the actual execution plan. Look at which operations run the longest.

Thanks for reading!

Going Further


If this is the kind of SQL Server stuff you love learning about, you’ll love my training. I’m offering a 75% discount to my blog readers if you click from here. I’m also available for consulting if you just don’t have time for that and need to solve performance problems quickly.

Understand Your Plan: Estimates And Actuals

But Really


Remember way back when maps were on paper? Some maps were so fancy they called themselves an atlas, even though you bought them at a gas station.

They were neat, and they were mostly right. If there was construction, or a road was closed for some reason, there was no way to update them fast enough to be useful.

Same deal with traffic. A route might look like the best way to go no matter what time of day you’re driving, but you wouldn’t know if it was a good idea until you started on your way.

You could hit all sorts of problems along the way, and in the age before cell phones, you wouldn’t be able to tell anyone what was happening.

Sure, you could stop at a pay phone, but everyone peed on those things and they had a bad habit of stealing your coins even if you could even remember the phone number.

I’ve said all that to say this: that’s a lot like SQL Server’s query plans today. Sure, Microsoft is making some improvements here with all the Intelligent Query Processing stuff.

Not much beyond adaptive joins are a runtime change in plan execution, though. A lot of it is stuff the optimizer adjusts between executions, like memory grants.

All Plans Are Estimates


By that I mean, win lose or draw, every execution plan you see is what the optimizer thought was the cheapest way to answer your question.

A whole lot of the time it’s right, even if it’s not perfect. There are some things I wish it were better at, for sure, like OR predicates.

For a long time I thought the costing algorithms should be less biased against random I/O, because it’s no longer a physical disk platter spinning about.

But then I saw how bad Azure storage performs, and I’m okay with leaving it alone.

Every choice in every execution plan is based on some early assumptions:

  • You’re on crappy storage
  • The data you want isn’t in the buffer pool
  • What you’re looking for exists in the data

There are some additional principles documented over here, like independence, uniformity, simple containment containment, and inclusion for the best cardinality estimator.

In the new cardinality estimator, you’ll find things like “correlation” and “base containment”. Humbug.

Plan, Actually


Estimated plans can be found in:

  • The plan cache
  • Query Store
  • Hitting CTRL + L or the “display estimated execution plan” button
  • Collecting post compilation events from Profiler or Extended Events
  • Somewhere in the middle is lightweight query profiling, which is also a total waste of time

These plans do not give you any details about where SQL Server’s plan choice was right or wrong, good or bad. Sometimes you can figure things out with them. Most of the time you’ll have to ask for an actual execution plan.

When you collect an actual execution plan, SQL Server adds in details about what happened when it executed the plan it estimated to be the cheapest. For a long time, it could still be hard to figure out where exactly you hit an issue.

That changed when Microsoft got an A+ gold star smiley face from their summer intern, who added operator times to query plans.

Actual execution plans can be found in:

  • Hitting CTRL + M or the “include actual execution plan” button
  • Collecting post execution events from Profiler or Extended Events

These are most useful when query tuning.

Reality Bites


They’re most useful because they tell the truth about what happened. Every roadblock, red light, overturned tractor trailer full of pig iron, and traffic jam that got hit along the way.

Things like:

  • Spills
  • Incorrect estimates
  • CPU time
  • Scalar UDF time
  • I/O performed
  • Wait stats (well, some of them)
  • Operator times

You get the idea. It’s a clear picture of what you might need to fix. You might not know how to fix it, but that’s what many of the other posts around here will help you with.

One thing that there’s no “actual” counterpart for are operator costs. They remain estimates. We’ll talk about those tomorrow.

Thanks for reading!

Going Further


If this is the kind of SQL Server stuff you love learning about, you’ll love my training. I’m offering a 75% discount to my blog readers if you click from here. I’m also available for consulting if you just don’t have time for that and need to solve performance problems quickly.

Understand Your Plan: Computing Scalars

Blank Slate


This is awful. It really is. It’s so awful. These operators skated by undetected for years. Acting so innocent with their 0% cost.

Subprime operators, or something.

In this post, I’m going to show you how compute scalars hide work, and how interpreting them in actual execution plans can even be tricky.

Most of the time, Compute Scalar operators are totally harmless. Most of the time.

Like this:

SELECT TOP (1)
    Id = 
        CONVERT
        (
            bigint,
            u.Id
        )
FROM dbo.Users AS u;

Has this plan:

SQL Server Query Plan
abandon

Paul White has a customarily deep and wonderful post about Compute Scalars, of course. Thankfully, he can sleep soundly knowing that my post will not overtake his for Compute Scalar supremacy.

I’m here to talk about when Compute Scalars go wild.

Mercy Seat


Compute Scalars are where Scalar User Defined Functions Hide. I know, SQL Server 2019, UDF inlining, blah blah blah.

Talk to me in five years when you finally upgrade to 2019 because your vendor just got around to certifying it.

Here’s where things get weird:

SELECT  
    @d = dbo.serializer(1)
FROM dbo.Badges AS b;
SQL Server Query Plan
wretched

Operator times in the query plan don’t match up with the Query Time Stats in the properties of the Select operator. It executed for ~108 seconds, but only ~3 seconds is accounted for.

For some reason, time isn’t tracked for variable assignment. If we use a similar query to dump the results into a #temp table, it works fine:

SELECT  
    d = dbo.serializer(1)
INTO #b
FROM dbo.Badges AS b;
SQL Server Query Plan
32 degrees

No wonder all the smart people are going over to MongoDB.

Aaron Bertrand


You know that guy? Never owned a piece of camouflage clothing. Blogs a bit. Has some wishy washy opinions about T-SQL.

Anyway, he recently wrote a couple conveniently-timed posts about FORMAT being an expensive function. Part 1, Part 2. The example here is based on his code.

SELECT  
    d = 
        CONVERT
        (
            varchar(50), 
            FORMAT
            (
                b.Date, 
                'D', 
                'en-us'
            )
        )
INTO #b
FROM dbo.Badges AS b;

Just a quick note that variable assignment of this function has the same behavior as the Scalar User Defined Function above, where operator time isn’t tracked, but it also isn’t tracked for the temp table insert:

SQL Server Query Plan
where did you go?

If you saw this query plan, you’d probably be very confused. I would be too. It helps to clarify a bit if we do the insert without the FORMAT funkiness.

SELECT  
    d = b.Date
INTO #bb
FROM dbo.Badges AS b;
SQL Server Query Plan
strange dreams

It only takes a few seconds to insert the unprocessed date. That should be enough to show you that in the prior plan, we spent ~60 seconds formatting dates.

Clams


Computer Scalar operators can really hide a lot of work. It’s a shame that it’s not tracked better.

When you’re tuning queries, particularly ones that feature Scalar User Defined Functions, you may want to take Computer Scalar costing with a mighty large grain of salt.

To recap some other points:

  • If operator times don’t match run time, check the Query Time Stats in the properties of the Select operator
  • FORMAT is nice and all, but…
  • Scalar User Defined Functions are quite poisonous

Thanks for reading!

Going Further


If this is the kind of SQL Server stuff you love learning about, you’ll love my training. I’m offering a 75% discount to my blog readers if you click from here. I’m also available for consulting if you just don’t have time for that and need to solve performance problems quickly.

Understand Your Plan: When Queries Use Batch Mode

Batchius Modius


Much like parallelism, Batch Mode is something I often resort to to make queries get reliably faster.

There aren’t a lot of great visual indicators in SSMS about when a query uses it, aside from:

  • Adaptive joins
  • Operator Properties (Execution Mode)
  • Window Aggregates
  • Parallel plans sometimes missing Exchange Operators
  • Your horrible reporting query finishes immediately for some reason

There might be more, but I’ve been day drinking.

Of course, it’s basically useless on Standard Edition:

https://erikdarling.com/sql-server/how-useful-is-column-store-in-standard-edition/

Heuristic Worship


Prior to SQL Server 2019, you needed to have a columnstore index present somewhere for batch mode to kick in for a query.

Somewhere is, of course, pretty loose. Just having one on a table used in a query is often enough, even if a different index from the table is ultimately used.

That opened up all sorts of trickery, like creating empty temporary or permanent tables and doing a no-op left join to them, on 1 = 0 or something along those lines.

Sure, you couldn’t read from rowstore indexes using batch mode doing that prior to SQL Server 2019, but any other operator that supported Batch Mode could use it.

  • Hash Joins
  • Hash Aggregates
  • Sorts
  • Window Aggregates
  • Filter
  • Compute Scalar
  • Others, but again, I’ve been day drinking

You can read more about the differences here:

https://erikdarling.com/sql-server/batch-mode-on-row-store-vs-batch-mode-tricks/

Homebody


With SQL Server 2019 Enterprise Edition, in Compatibility Level 150, SQL Server can decide to use Batch Mode without a columnstore index, even reading from rowstore indexes in Batch Mode.

The great thing is that you can spend hours tediously tuning queries and indexes to get exactly the right plan and shape and operators or you can just use Batch Mode and get back to day drinking.

Trust me.

To get a sense of when you should be trying to get Batch Mode in your query plans, check out this post:

https://erikdarling.com/sql-server/signs-you-need-batch-mode-for-your-sql-server-queries/

Thanks for reading!

Going Further


If this is the kind of SQL Server stuff you love learning about, you’ll love my training. I’m offering a 75% discount to my blog readers if you click from here. I’m also available for consulting if you just don’t have time for that and need to solve performance problems quickly.

Understand Your Plan: When Queries Go Parallel

Zip Zap Fast


Parallel queries were originally conceived of by David Lee Roth in 198X. He doesn’t remember exactly. It’s cool.

In some cases, they’re the only reasonable option. If your query is processing millions of rows, spreading them out across a bunch of worker threads will reduce wall clock time (assuming nothing goes terribly, horribly wrong elsewhere).

It doesn’t necessarily increase CPU time, though. Again, perfect world (we’re optimists here at Darling Data):

  • One thread processing 8 million rows takes one 8 seconds
  • Eight threads processing 1 million rows a piece takes 1 second

Either way, you’re looking at 8 seconds of CPU time, but it changes how that’s spread out and who feels it.

  • On a single thread, it happens over eight person-seconds to a human being
  • One eight threads, it happens over 1 person seconds, but the “strain” is on the CPUs doing extra work

Your Own Parallel Query


In my corner of the query tuning world, parallelism is the only way to speed up some queries. There’s only so much work you can stick on one thread and get it going faster.

Often, queries aren’t going parallel because of some limiting factor:

  • Scalar UDFs anywhere near the vicinity
  • Inserting to table variables
  • Linked server queries
  • Cursor options

There are also times when every query is going overly-parallel because:

Neither situation is ideal.

Why Getting Settings Right Is So Tough


We all know the default suck. MAXDOP at 0 and Cost Threshold For Parallelism at 5 is dumb for anything north of Northwinds.

Check out this video to hear my thoughts on it:

Accosted


The other thing that’s really tough to reason out about setting Cost Threshold For Parallelism is that every single thing related to cost you see, whether it’s for the entire plan, or just a single operator, is an estimate.

Estimates are… Well, have you ever gotten one? Has it ever been 100%? If you’ve ever hired a contractor, hoo boy. You’re sweating now.

Expensive queries can be fast. Cheap queries can be slow. Parameterized queries can be cheap and fast, but if you get into a situation with bad parameter sniffing, that cheap fast plan can turn into an insufferable relationship.

Yeah, I’m one of those people who usually starts off by bumping Cost Threshold For Parallelism to 50. It’s reasonable enough, and I don’t get married to it. I’m open to changing it if there’s evidence that’s necessary. Plus, it’s pretty low risk to experiment with.

My dear friend Michael J Swart has a Great Post about measuring changes to it here.

The important thing to keep in mind with any of these settings, aside from the defaults being bad, is that you’re not setting them with the goal of eliminating CXPACKET and CXCONSUMER waits completely. Unless you’re running a pure virgin OLTP system, that’s a real bad idea.

Thanks for reading!

Going Further


If this is the kind of SQL Server stuff you love learning about, you’ll love my training. I’m offering a 75% discount to my blog readers if you click from here. I’m also available for consulting if you just don’t have time for that and need to solve performance problems quickly.

Understand Your Plan: Operators That Use Memory Grants

What’s The Point?


Whoever called memory a “bank” was a smart cookie. Everything you get from RAM is a loan.

In SQL Server, queries can get memory loaned to them while they execute. The most common reasons for memory grants are Sorts and Hashes. You may also see them for an Optimized Nested Loops Join, but whatever.

Memory is such an important aspect of query and overall server performance that it really helps to understand when there’s pressure on it, and where it’s coming from.

It’s sort of funny, you read any article about PAGEIOLATCH waits, and people are sitting there telling you that you have a problem with your disk subsystem and whatnot and to investigate that. Buy SSDs.

They never tell you to add memory to be less reliant on disk. I do, but that’s because I love you and want you to be happy and smart.

But this ain’t about that, it’s about this. And this is query memory grants.

How Much?


If you’re on Standard Edition, or using the default Resource Governor settings on Enterprise Edition, any query can come along and suck up up to ~25% of your server’s max server memory setting.

Ain’t that just crackers?

Would you also believe that SQL Server will give out 75% of that setting to queries, and there’s no way to control that? At least not without a bunch of complicated Resource Governor

All that can add up to some severe contention issues. Especially because SQL Server tends to way overestimate memory grants. String columns are lit’rally the devil.

But SQL Server isn’t totally out to get you, either. Some operators can share memory, and parallelism splits up memory grants across threads.

At least until SQL Server 2019, where Batch Mode On Row Store made everything… well, more crackers.

If you’ve been using columnstore for a while, you probably already know these pains.

Fixing Them?


If you need to “fix” a specific query quickly, you can use the MIN and MAX grant percent hints. That allows you to set high and low boundaries for what a single memory can be granted for memory.

Remember that indexes put data in order, and having ordered data can increase the chances of you getting order-friendly algorithms, and decrease your need to ask for memory to sort data in.

Consider joins and aggregates:

  • Hash Joins are typically chosen for large, unordered sets
  • Merge Joins require ordered sets
  • Hash Aggregates are typically chosen for large, unordered sets
  • Stream Aggregates require ordered sets

If you index columns appropriately, you make the choice for using ordered algorithms more likely. Without an index putting that data in order, the optimizer would have to choose to add a Sort to the query plan for them to occur.

That can sometimes be costed out of the realm of existence, and that’s fine. Sorts can be pretty rough.

If you need some help figuring that stuff out, check out these posts:

Thanks for reading!

Going Further


If this is the kind of SQL Server stuff you love learning about, you’ll love my training. I’m offering a 75% discount to my blog readers if you click from here. I’m also available for consulting if you just don’t have time for that and need to solve performance problems quickly.

Understand Your Plan: Operators That Write Data (Spools, Spools, Spools)

Four Non Mods


This post isn’t about modifying data. I don’t believe in doing that; get your data right the first time and you’ll avoid a lot of issues. You’ll also never need to worry about Merge.

I kid, of course. You’re doing great with it. Good for you.

This post also isn’t about things that oh-look-how-technically-correct-I-am may also write data via workfiles or worktables.

  • Many to many merge joins
  • Hash joins aggregates
  • A bunch of other stuff that won’t make you popular to know about

This post is about one of my query plan frenemies: Spools. Spools of all variety, lazy and eager.

There are other kinds of spools too, like rowcount spools and window spools, but they’re different enough that I can’t generalize them in with other types.

For example, rowcount spools only keep a count; they don’t track a full data set. Sure, you may be able to rewrite queries when you see them, but this is about how they operate.

Ditto window spools. I typically don’t sweat those unless someone uses a window function and doesn’t specify the ROWS in the OVER clause. The default is RANGE, and uses a far less efficient disk-based spool.

With that out of the way, let’s part on with the other two.

What’s A Spool To Do


Spools are temporary structures that get stuck over in tempdb. They’re a bit like temp tables, though they don’t have any of the optimizations and enhancements. For example, loading data into a spool is a row-by-row operation.

The structure that spools use varies a bit. Table spools use a “clustered index”, but it’s not built on any of the columns in your data. Index spools use the same thing, but it’s defined on columns in your data that the optimizer thinks would make some facet of the query faster.

In both cases, these spools are used in an attempt to do less work on the inner sign of a nested loops join, either by:

  • Table Spool: Reducing how many times the branch executes by only running for unique values
  • Index Spool: Creating a more opportune index structure to seek to rows in

I don’t think of Spools as always bad, but I do think of them as something to investigate. Particularly Eager Index Spools, but Table Spools can act up too.

You may see Spools in modification queries that can be tuned, or are just part of modifying indexes.

Lazy v. Eager


Lazy spools load data as requested, and then truncate themselves to honor a new request (except Lazy Index Spools, which don’t truncate).

In Spool operator properties, you’ll see things like “Rewinds” and “Rebinds”. You can think of rewinds like reusing data in the spool, and Rebinds like putting a new set of data in. You can sometimes judge the efficacy of a Lazy Table Spool by looking at actual rebind vs. rewinds.

If rebinds are and rewinds are close in count, it may not have been an effective spool. These numbers for Lazy Index Spools are almost useless. Don’t look at them.

Eager spools load all the data at once. Where you have to be careful with them is when you see Eager Index spools on large tables.

  • No missing index request
  • Data is loaded on a single thread even in a parallel plan
  • Data is loaded row by row
  • Index is thrown out when the query finishes

Look, these are bad traits. They’re so bad I’ve dedicated a lot of blog space to writing about them:

https://erikdarling.com/sql-server/a-query-to-help-you-find-plans-with-eager-index-spools/

https://erikdarling.com/sql-server/eager-index-spool-annoyances/

https://erikdarling.com/sql-server/spool-and-spool-alike/

https://erikdarling.com/sql-server/spool-sizes-and-the-select-list/

https://erikdarling.com/sql-server/things-sql-server-vnext-should-address-spools/

https://erikdarling.com/sql-server/spools-are-just-crappy-temp-tables/

https://erikdarling.com/plan-cache-liars/signs-your-execution-plan-is-lying-to-you-index-spools/

Thanks for reading!

Going Further


If this is the kind of SQL Server stuff you love learning about, you’ll love my training. I’m offering a 75% discount to my blog readers if you click from here. I’m also available for consulting if you just don’t have time for that and need to solve performance problems quickly.

Understand Your Plan: Processing Data With A Join Operator

Your Girlfriend


Anyone who tells you there are only three types of joins in SQL Server isn’t your friend.

Okay, maybe that’s harsh. Maybe they’re just getting you prepared for the bonne promenade through all the many different faces a join can wear in your query plans.

Maybe they have a great explanation for Grace Hash Joins in their back pocket that they’re waiting to throw in your face like a bunch of glitter.

Maybe.

Nested Loops Join


Nested loops are the join type that everyone starts talking about, so in the interest of historical familiarity, I will too. And you’ll like it. Because that’s what you’re used to.

Some things to look for in the properties of a Nested Loops join:

  • Prefetching (can be ordered or not ordered)
  • Vanilla Nested Loops (predicate applied at the join)
  • Apply Nested Loops (Outer Reference at join operator, predicate applied at index)
  • As part of a Lookup (key or bookmark)

Nested Loops work best a relatively small outer input, and an index to support whatever join conditions and other predicates against the inner table.

When the outer side of a Nested Loops Join results in N number of scans on the inner side, you can usually expect performance to be unsatisfactory.

This may be part of the reason why Adaptive Joins have the ability to make a runtime decision to choose between Hash and Nested Loops Joins.

Right now, Nested Loops Joins can’t execute in Batch Mode. They do support parallelism, but the optimizer is biased against those plans, and cost reductions are only applied to the outer side of the plan, not the inner side.

A fun piece of SQL Jeopardy for the folks watching along at home: these are the only type of joins that don’t require an equality predicate. Wowee.

This is how Microsoft keeps consultants employed.

Merge Join


Traditionally in second place, though I wish they’d be done away with, are Merge Joins.

People always say things like “I wish I had a dollar for every time blah blah blah”, but at this point I think I do have a dollar for every time a Merge Join has sucked the life out of a query.

If you’ll permit me to make a few quick points, with the caveat that each should have “almost always” injected at some point:

  • Many to Many Merge Joins were a mistake

    SQL Server Query Plan
    trash
  • Sort Merge plans were a mistake
  • Parallel Merge Joins were a mistake

Merge joins don’t support Batch Mode, and are not part of the Adaptive Join decision making process. That’s how terrible they are.

Part of what makes them terrible is that they expect ordered input. If you don’t have an index that does that, SQL Server’s Cost Based Optimizer might fly right off the handle and add a Sort into your query plan to satisfy our precious little Merge Join.

The gall.

In a parallel plan, this can be especially poisonous. All that expected ordering can result in thread to thread dependencies that may lead to exchange spills or outright parallel deadlocks.

Merge Joins were a mistake.

Hash Join


Ah, Hash Joins. Old Glory. Supporters of Adaptive Joins and Batch Mode, and non-requirers of ordered inputs.

Hail To The Hash, baby.

That isn’t to say that they’re perfect. You typically want to see them in reporting queries, and you typically don’t want to see them in OLTP queries. Sometimes they’re a sign that of a lack of indexing in the latter case.

There are all sorts of neat little details about Hash Joins, too. I am endlessly fascinated by them.

Take bitmaps, for example. In parallel row mode plans, they’re way out in the open. In batch mode plans, they’re only noted in the hash join operator, where you’ll see the BitmapCreator property set to true. In serial row mode plans, they get even weirder. They’re always there, they’re always invisible, and there’s no way to visually detect them.

Semi Joins and Anti-Semi Joins


You may see these applied to any of the above types of joins, which are a bit different from inner, outer, full, and cross joins in how they accept or reject rows.

They’ll usually show up when you use

  • EXISTS
  • NOT EXISTS
  • INTERSECT
  • EXCEPT

Where they differ is in their:

  • Treatment of duplicate matches
  • Treatment of NULLs
  • Ability to accept or reject rows at the join

Both EXISTS and NOT EXISTS stop looking once they find their first match. They do not produce duplicates in one to many relationships.

NOT EXISTS doesn’t get confused by NULLs the way that NOT IN does, and both INTERSECT and EXCEPT handle NULLs differently than equality predicates.

Thanks for reading!

Going Further


If this is the kind of SQL Server stuff you love learning about, you’ll love my training. I’m offering a 75% discount to my blog readers if you click from here. I’m also available for consulting if you just don’t have time for that and need to solve performance problems quickly.

Understand Your Plan: Processing Data With An Aggregate Operator

Smack Dab


Aggregates can be useful for all sorts of things in a query plan, and can show up in many different forms.

It would be tough to cover all of them in a single post, but what I’d like to do is help all you nice folks out there understand some of their finer points.

Streaming and Hashing


The two main types of aggregates you’ll see in SQL Server query plans are:

  • Stream Aggregate (expect ordered data)
  • Hash Aggregate (don’t care about order)

Of course, they break down into more specific types, too.

  • Partial aggregates (an early attempt to reduce rows)
  • Scalar aggregates (returning a sum or count without a group by, for example)
  • Vector aggregates (with a group by)

And if you want to count more analytical/windowing functions, you might also see:

  • Segment/Sequence project (row mode windowing functions)
  • Window Aggregates (batch mode windowing functions)

To learn more about partial aggregates, check out this post.

Aggregation Ruling The Nation


One of the big benefits of aggregates is, of course, making a set of values distinct. This can be particularly help around joins, especially Merge Joins where the many to many type can cause a whole lot of performance issues.

That being said, not every aggregation is productive. For example, some aggregations might happen because the optimizer misjudges the number of distinct values in a set. When this happens, often other misestimates will follow.

Two of the biggest factors for this going awry are:

  • Memory grants for sorts and aggregations across the execution plan
  • Other operators chosen based on estimated row counts being much lower

Here are some examples:

SQL Server Query Plan
creep

This hash match aggregate is the victim of a fairly large misestimation, and ends up spilling out to disk. In this case, the spill is pretty costly from a performance perspective and ends up adding about 5 seconds to the query plan.

SQL Server Query Plan
distorted

Here, a hash match aggregate misestimates again, but now you can see it impact the next operator over, too. The sort just didn’t have enough of a memory grant to avoid spilling. We add another few seconds onto this one.

SQL Server Query Plan
contagious

In extreme cases, those spills can really mess things up. This one carries on for a couple minutes, doing nothing but hashing, spilling, and having a bad time.

Thanks for reading!

Going Further


If this is the kind of SQL Server stuff you love learning about, you’ll love my training. I’m offering a 75% discount to my blog readers if you click from here. I’m also available for consulting if you just don’t have time for that and need to solve performance problems quickly.