How SQL Server 2019 Helps You Link Queries To Missing Index Requests

Not Another Upgrade


When dm_db_missing_index_group_stats_query got documented, I was really happy. After all, this has been a peeve of mine for ages.

“Wow look at all these missing index requests. Where’d they come from?”

So this is neat! And it’s better than nothing, but there are some quirks.

And what’s a quirk, after all, but a twerk that no one enjoys.

Columnar


The first thing to note about this DMV is that there are two columns purporting to have sql_handles in them. No, not that sql_handle.

One of them can’t be used in the traditional way to retrieve query text. If you try to use last_statement_sql_handle, you’ll get an error.

SELECT
    ddmigsq.group_handle,
    ddmigsq.query_hash,
    ddmigsq.query_plan_hash,
    ddmigsq.avg_total_user_cost,
    ddmigsq.avg_user_impact,
    query_text = 
        SUBSTRING
        (
            dest.text, 
            (ddmigsq.last_statement_start_offset / 2) + 1,
            (
                ( 
                    CASE ddmigsq.last_statement_end_offset 
                        WHEN -1 
                        THEN DATALENGTH(dest.text) 
                        ELSE ddmigsq.last_statement_end_offset 
                    END
                    - ddmigsq.last_statement_start_offset 
                ) / 2 
            ) + 1
        )
FROM sys.dm_db_missing_index_group_stats_query AS ddmigsq
CROSS APPLY sys.dm_exec_sql_text(ddmigsq.last_statement_sql_handle) AS dest;

Msg 12413, Level 16, State 1, Line 27
Cannot process statement SQL handle. Try querying the sys.query_store_query_text view instead.

Is Vic There?


One other “issue” with the view is that entries are evicted from it if they’re evicted from the plan cache. That means that queries with recompile hints may never produce an entry in the table.

Is this the end of the world? No, and it’s not the only index-related DMV that behaves this way: dm_db_index_usage_stats does something similar with regard to cached plans.

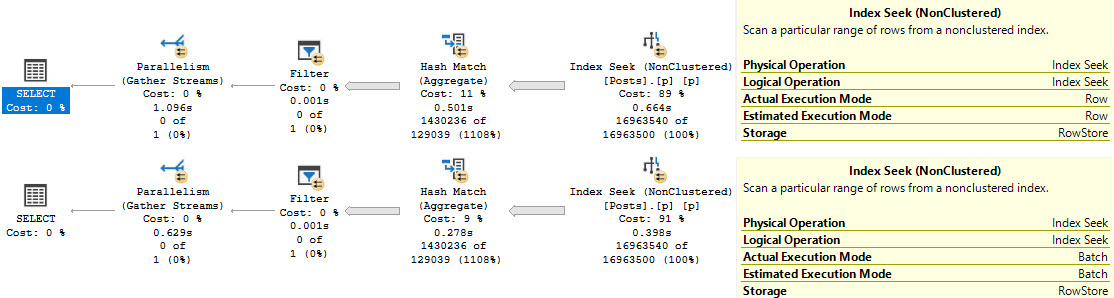
As a quick example, if I execute these two nearly-identical queries, the DMV only records one potential use of the index:

SELECT 
    COUNT_BIG(*)
FROM dbo.Posts AS p
WHERE p.OwnerUserId = 22656
AND   p.Score < 0;
GO 

SELECT 
    COUNT_BIG(*)
FROM dbo.Posts AS p
WHERE p.OwnerUserId = 22656
AND   p.Score < 0
OPTION(RECOMPILE);
GO
SQL Server Missing Index Request
grizzly

Italic Stallion


You may have noticed that may was italicized in when talking about whether or not plans with recompile hints would end up in here.

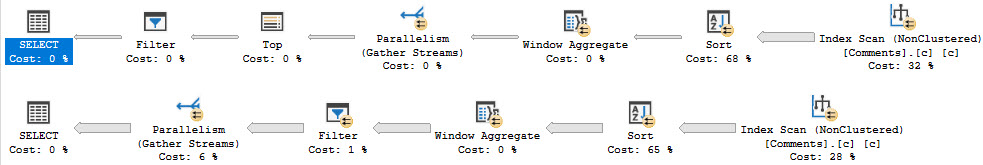
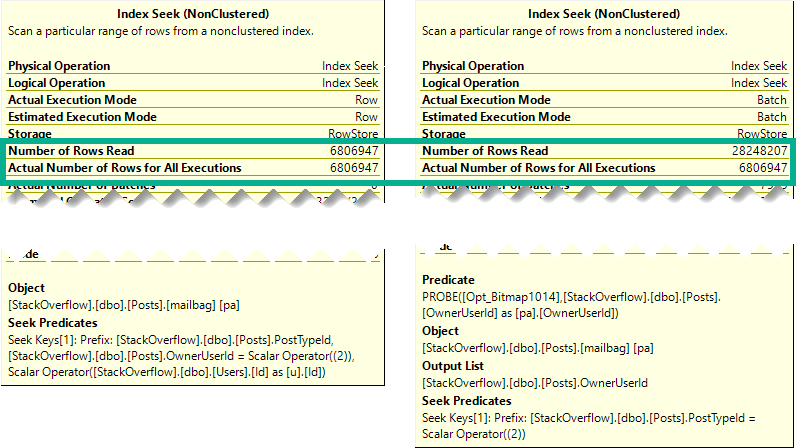
Some of them may, if they’re part of a larger batch. Here’s an example:

SELECT 
    COUNT_BIG(*)
FROM dbo.Posts AS p
WHERE p.OwnerUserId = 22656
AND   p.Score < 0
OPTION(RECOMPILE);

SELECT
    COUNT_BIG(*)
FROM dbo.Users AS u
JOIN dbo.Posts AS p
   ON p.OwnerUserId = u.Id
JOIN dbo.Comments AS c
    ON c.PostId = p.Id
WHERE u.Reputation = 1
AND   p.PostTypeId = 3
AND   c.Score = 0;

Most curiously, if I run that batch twice, the missing index request for the recompile plan shows two uses.

computer

Multiplicity


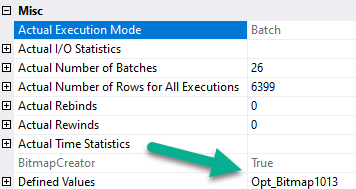
You may have also noticed something odd in the above screenshot, too. One query has produced three entries. That’s because…

The query has three missing index requests. Go ahead and click on that.

lovecraft, baby

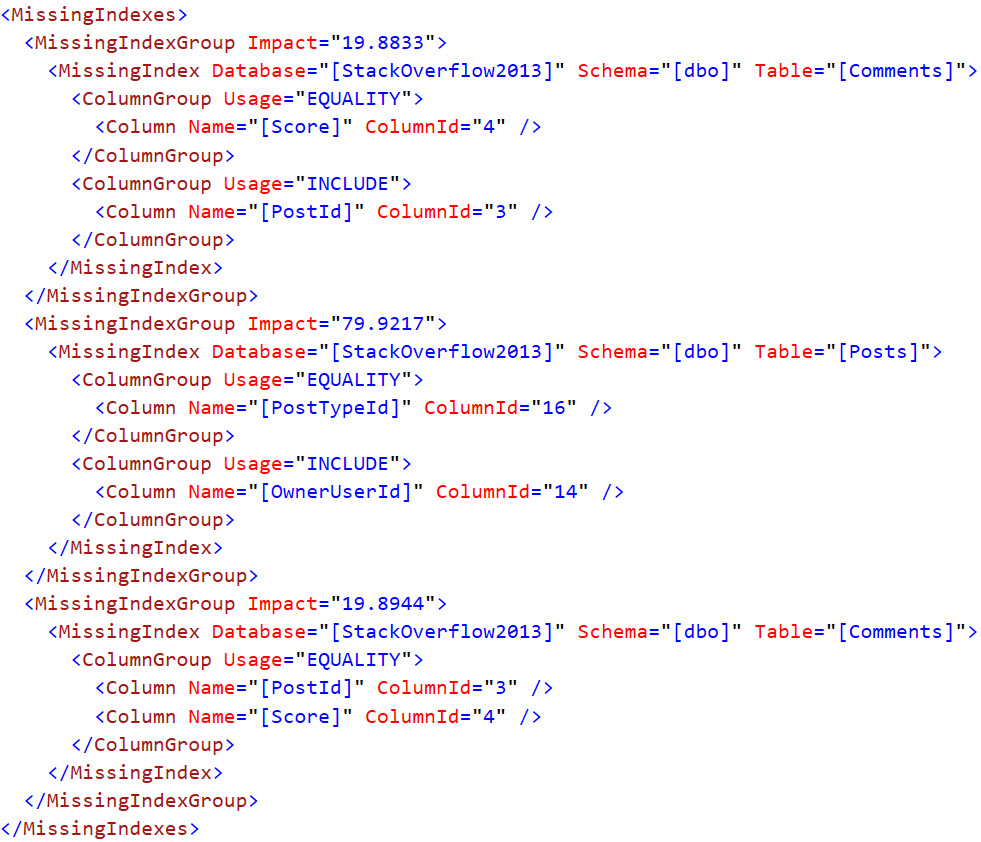
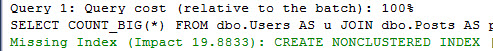
Another longstanding gripe with SSMS is that it only shows you the first missing index request in green text, and that it might not even be the “most impactful” one.

That’s the case here, just in case you were wondering. Neither the XML, nor the SSMS presentation of it, attempt to order the missing indexes by potential value.

You can use the properties of the execution plan to view all missing index requests, like I blogged about here, but you can’t script them out easily like you can for the green text request at the top of the query plan.

something else

At least this way, it’s a whole heck of a lot easier for you to order them in a way that may be more beneficial.

EZPZ


Of course, I don’t expect you to write your own queries to handle this. If you’re the type of person who enjoys Blitzing things, you can find the new 2019 goodness in sp_BlitzIndex, and you can find all the missing index requests for a single query in sp_BlitzCache in a handy-dandy clickable column that scripts out the create statements for you.

Thanks for reading!

Going Further


If this is the kind of SQL Server stuff you love learning about, you’ll love my training. I’m offering a 75% discount to my blog readers if you click from here. I’m also available for consulting if you just don’t have time for that and need to solve performance problems quickly.

A Bug With Recursive UDFs When Inlined In SQL Server 2019

Enough Already


I see people do things like this fairly often with UDFs. I don’t know why. It’s almost like they read a list of best practices and decided the opposite was better.

This is a quite simplified function, but it’s enough to show the bug behavior.

While writing this, I learned that you can’t create a recursive (self-referencing) scalar UDF with the schemabinding option. I don’t know why that is either.

Please note that this behavior has been reported to Microsoft and will be fixed in a future update, though I’m not sure which one.

Swallowing Flies


Let’s take this thing. Let’s take this thing and throw it directly in the trash where it belongs.

CREATE OR ALTER FUNCTION dbo.how_high
(
    @i int,
    @h int
)
RETURNS int
WITH
    RETURNS NULL ON NULL INPUT
AS
BEGIN

    SELECT 
       @i += 1;
    
    IF @i < @h
    BEGIN
        SET 
            @i = dbo.how_high(@i, @h);
    END;

    RETURN @i;

END;
GO

Seriously. You’re asking for a bad time. Don’t do things like this.

Unless you want to pay me to fix them later.

Froided


In SQL Server 2019, under compatibility level 150, this is what the behavior looks like currently:

/*
Works
*/
SELECT 
    dbo.how_high(0, 36) AS how_high;
GO 

/*
Fails
*/
SELECT 
    dbo.how_high(0, 37) AS how_high;
GO

The first execution returns 36 as the final result, and the second query fails with this message:

Msg 217, Level 16, State 1, Line 40
Maximum stored procedure, function, trigger, or view nesting level exceeded (limit 32).

A bit odd that it took 37 loops to exceed the nesting limit of 32.

This is the bug.

Olded


With UDF inlining disabled, a more obvious number of loops is necessary to encounter the error.

/*
Works
*/
SELECT 
    dbo.how_high(0, 32) AS how_high
OPTION (USE HINT('DISABLE_TSQL_SCALAR_UDF_INLINING'));
GO 

/*
Fails
*/
SELECT 
    dbo.how_high(0, 33) AS how_high
OPTION (USE HINT('DISABLE_TSQL_SCALAR_UDF_INLINING'));
GO

The first run returns 32, and the second run errors out with the same error message as above.

Does It Matter?


It’s a bit hard to imagine someone relying on that behavior, but I found it interesting enough to ask some of the nice folks at Microsoft about, and they confirmed that it shouldn’t happen. Again, it’ll get fixed, but I’m not sure when.

Thanks for reading!

Going Further


If this is the kind of SQL Server stuff you love learning about, you’ll love my training. I’m offering a 75% discount to my blog readers if you click from here. I’m also available for consulting if you just don’t have time for that and need to solve performance problems quickly.

Temporary Object Concurrency With In-Memory tempdb Metadata In SQL Server 2019

Moisty


Thanks for watching!

Going Further


If this is the kind of SQL Server stuff you love learning about, you’ll love my training. I’m offering a 75% discount to my blog readers if you click from here. I’m also available for consulting if you just don’t have time for that and need to solve performance problems quickly.

Database Context Is Everything In SQL Server

Full Frontal


Going Further


If this is the kind of SQL Server stuff you love learning about, you’ll love my training. I’m offering a 75% discount to my blog readers if you click from here. I’m also available for consulting if you just don’t have time for that and need to solve performance problems quickly.

When Does Scalar UDF Inlining Work In SQL Server?

The Eye


UPDATE: After writing this and finding the results fishy, I reported the behavior described below in “Somewhat Surprising” and “Reciprocal?” and it was confirmed a defect in SQL Server 2019 CU8, though I haven’t tested earlier CUs to see how far back it goes. If you’re experiencing this behavior, you’ll have to disable UDF inlining in another way, until CU releases resume in the New Year.

With SQL Server 2019, UDF inlining promises to, as best it can, inline all those awful scalar UDFs that have been haunting your database for ages and making queries perform terribly.

But on top of the long list of restrictions, there are a number of other things that might inhibit it from kicking in.

For example, there’s a database scoped configuration:

ALTER DATABASE SCOPED CONFIGURATION SET TSQL_SCALAR_UDF_INLINING = ON/OFF; --Toggle this

SELECT 
    dsc.*
FROM sys.database_scoped_configurations AS dsc
WHERE dsc.name = N'TSQL_SCALAR_UDF_INLINING';

There’s a function characteristic you can use to turn them off:

CREATE OR ALTER FUNCTION dbo.whatever()
RETURNS something
WITH INLINE = ON/OFF --Toggle this
GO

And your function may or not even be eligible:

SELECT 
    OBJECT_NAME(sm.object_id) AS object_name,
    sm.is_inlineable
FROM sys.sql_modules AS sm
JOIN sys.all_objects AS ao
    ON sm.object_id = ao.object_id
WHERE ao.type = 'FN';

Somewhat Surprising


One thing that caught me off guard was that having the database in compatibility level 140, but running the query in compatibility level 150 also nixed the dickens out of it.

DBCC FREEPROCCACHE;
GO 

ALTER DATABASE StackOverflow2013 SET COMPATIBILITY_LEVEL = 140;
GO 

WITH Comments AS 
(
    SELECT
        dbo.serializer(1) AS udf, --a function
        ROW_NUMBER() 
            OVER(ORDER BY 
                     c.CreationDate) AS n
    FROM dbo.Comments AS c
)
SELECT 
    c.*
FROM Comments AS c
WHERE c.n BETWEEN 1 AND 100
OPTION(USE HINT('QUERY_OPTIMIZER_COMPATIBILITY_LEVEL_150'), MAXDOP 8);
GO

Our query has all the hallmarks of one that has been inflicted with functions:

SQL Server Query Plan
it can’t go parallel

And if you’re on SQL Server 2016+, you can see that it executes once per row:

SELECT 
    OBJECT_NAME(defs.object_id) AS object_name,
    defs.execution_count,
    defs.total_worker_time,
    defs.total_physical_reads,
    defs.total_logical_writes,
    defs.total_logical_reads,
    defs.total_elapsed_time
FROM sys.dm_exec_function_stats AS defs;
SQL Server Query Plan
rockin’ around

Reciprocal?


There’s an odd contradiction here, though. If we repeat the experiment setting the database compatibility level to 150, but running the query in compatibility level 140, the function is inlined.

DBCC FREEPROCCACHE;
GO 

ALTER DATABASE StackOverflow2013 SET COMPATIBILITY_LEVEL = 150;
GO 

WITH Comments AS 
(
    SELECT
        dbo.serializer(c.Id) AS udf,
        ROW_NUMBER() 
            OVER(ORDER BY 
                     c.CreationDate) AS n
    FROM dbo.Comments AS c
)
SELECT 
    c.*
FROM Comments AS c
WHERE c.n BETWEEN 1 AND 100
OPTION(USE HINT('QUERY_OPTIMIZER_COMPATIBILITY_LEVEL_140'), MAXDOP 8);
GO

Rather than seeing a non-parallel plan, and non-parallel plan reason, we see a parallel plan, and an attribute telling us that a UDF has been inlined.

SQL Server Query Plan
call hope

And if we re-check the dm_exec_function_stats DMV, it will have no entries. That seems more than a little bit weird to me, but hey.

I’m just a lowly consultant on SSMS 18.6

Thanks for reading!

Going Further


If this is the kind of SQL Server stuff you love learning about, you’ll love my training. I’m offering a 75% discount to my blog readers if you click from here. I’m also available for consulting if you just don’t have time for that and need to solve performance problems quickly.

An Overlooked Benefit Of Batch Mode With Windowing Functions In SQL Server

Lavender


If you ask people who tune queries why batch mode is often much more efficient with windowing functions, they’ll tell you about the window aggregate operator.

That’s all well and good, but there’s another, often sneaky limitation of fully row mode execution plans with windowing functions.

Let’s go take a look!

Global Aggregates


One thing that causes an early serial zone in execution plans is if you use a windowing function that only has the order by

For example, let’s look at the plans for these two queries:

WITH Comments AS 
(
    SELECT
        ROW_NUMBER() 
            OVER(ORDER BY 
                     c.CreationDate) AS n
    FROM dbo.Comments AS c
)
SELECT *
FROM Comments AS c
WHERE c.n = 0;

WITH Comments AS 
(
    SELECT
        ROW_NUMBER() 
            OVER(PARTITION BY 
                     c.UserId
                 ORDER BY 
                     c.CreationDate) AS n
    FROM dbo.Comments AS c
)
SELECT *
FROM Comments AS c
WHERE c.n = 0;

The resulting estimated plans look like this, using the 140 compatibility level:

SQL Server Query Plan
oops

In the top plan, where the windowing function only has an order by, the serial zone happens immediately before the Segment operator. In the second plan, the parallel zone carries on until right before the select operator.

If you’re wondering why we’re only looking at estimated plans here, it’s because repartition streams ruins everything.

In The Year 2000


In compatibility level 150, things change a bit (yes, a window aggregate appears):

SQL Server Query Plan
merry christmas

And the window aggregate appears within the parallel zone. The parallel zone does end before the filter operator, which may or may not be a disaster depending on how restrictive your filter is, and how many rows end up at it.

Also note the distinct lack of a repartition streams operator ruining everything. We’ll talk about that tomorrow.

Thanks for reading!

Going Further


If this is the kind of SQL Server stuff you love learning about, you’ll love my training. I’m offering a 75% discount to my blog readers if you click from here. I’m also available for consulting if you just don’t have time for that and need to solve performance problems quickly.

Batch Mode On Row Store vs Batch Mode Tricks For Performance Tuning SQL Server Queries

Quiet Time


I think Batch Mode is quite spiffy for the right kind of query, but up until SQL Server 2019, we had to play some tricks to get it:

  • Do a funny join to an empty table with a column store index
  • Create a filtered column store index with no data in it

If you’re on SQL server 2019 Enterprise Edition, and you’ve got your database in compatibility level 150, you may heuristically receive Batch Mode without those tricks.

One important difference between Batch Mode Tricks™ and Batch Mode On Rowstore (BMOR) is that the latter allows you to read from row mode tables using Batch Mode, while the former doesn’t.

Tricks have limits, apparently.

Squish Squish


To cut down on typing, I’ll often create a helper object like this:

CREATE TABLE dbo.t
(
    id int NULL,
    INDEX c CLUSTERED COLUMNSTORE
);

If you read this post, you’ll understand more why.

Now, let’s compare these two queries:

SELECT 
    p.OwnerUserId,
    COUNT_BIG(*) AS records
FROM dbo.Posts AS p
LEFT JOIN dbo.t
    ON 1 = 0
WHERE p.Score < 50
GROUP BY p.OwnerUserId
HAVING COUNT_BIG(*) > 2147483647
OPTION(USE HINT('QUERY_OPTIMIZER_COMPATIBILITY_LEVEL_140'), MAXDOP 8);

SELECT 
    p.OwnerUserId,
    COUNT_BIG(*) AS records
FROM dbo.Posts AS p
WHERE p.Score < 50
GROUP BY p.OwnerUserId
HAVING COUNT_BIG(*) > 2147483647
OPTION(USE HINT('QUERY_OPTIMIZER_COMPATIBILITY_LEVEL_150'), MAXDOP 8);

One executes in compatibility level 140, the other in 150.

Splish Splash


There are a couple interesting things, here.

SQL Server Query Plan
the porter

Even though both queries have operators that execute in Batch Mode (Filter, Hash Match), only the second query can read from the row store clustered index in Batch Mode. In this case, that shaves a couple hundred milliseconds off the seek.

There is likely some additional invisible benefit to not having to convert the row mode seek to a batch mode hash join at the next operator, since one executes for 501ms, and the other executes for 278ms. There’s nothing in the query plan to signal that happening, so you’ll just have to use your imagination.

Thanks for reading!

Going Further


If this is the kind of SQL Server stuff you love learning about, you’ll love my training. I’m offering a 75% discount to my blog readers if you click from here. I’m also available for consulting if you just don’t have time for that and need to solve performance problems quickly.

Streaming Week: Query Performance Weirdness In SQL Server 2019 With Batch Mode

awks ox


Going Further


If this is the kind of SQL Server stuff you love learning about, you’ll love my training. I’m offering a 75% discount to my blog readers if you click from here. I’m also available for consulting if you just don’t have time for that and need to solve performance problems quickly.

SQL Server 2019: When Batch Mode On Rowstore Isn’t Better For Performance

Um Hello


WHAT DO YOU MEAN YOU’RE NOT ON SQL SERVER 2019 YET.

Oh. Right.

That.

Regressed


Look, whenever you make changes to the optimizer, you’re gonna hit some regressions.

And it’s not just upgrading versions, either. You can have regressions from rebuilding or restarting or recompiling or a long list of things.

Databases are terribly fragile places. You have to be nuts to work with them.

I’m not mad at 2019 or Batch Mode On Rowstore (BMOR) or anything.

But if I’m gonna get into it, I’m gonna document issues I run into so that hopefully they help you out, too.

One thing I ran into recently was where BMOR kicked in for a query and made it slow down.

Repro


Here’s my index:

CREATE INDEX mailbag ON dbo.Posts(PostTypeId, OwnerUserId) WITH(DATA_COMPRESSION = ROW);

And here’s my query:

SELECT u.Id, u.DisplayName, u.Reputation,
       (SELECT COUNT_BIG(*) FROM dbo.Posts AS pq WHERE pq.OwnerUserId = u.Id AND pq.PostTypeId = 1) AS q_count,
       (SELECT COUNT_BIG(*) FROM dbo.Posts AS pa WHERE pa.OwnerUserId = u.Id AND pa.PostTypeId = 2) AS a_count
FROM dbo.Users AS u
WHERE u.Reputation >= 25000
ORDER BY u.Id;

It’s simplified a bit from what I ran into, but it does the job.

Batchy

This is the batch mode query plan. It runs for about 2.6 seconds.

SQL Server Query Plan
who would complain?

Rowy

And here’s the row mode query plan. It runs for about 1.3 seconds.

SQL Server Query Plan
oh that’s why.

What Happened?


Just when you think the future is always faster, life comes at you like this.

So why is the oldmode query more than 2x faster than the newhotmode query?

There are a reason, and it’s not very sexy.

Batch Like That

First, the hash joins produce Bitmaps.

SQL Server Query Plan Tool Tip
bitted

You don’t see Bitmaps in Batch Mode plans as operators like you’re used to in Row Mode plans. You have to look at the properties (not the tool tip) of the Hash Join operator.

Even though both plans seek into the index on Posts, it’s only for the PostTypeId in the Batch Mode plan.

It would be boring to show you both, so I’m just going to use the details from the branch where we find PostTypeId = 2.

SQL Server Query Plan Tool Tip
buck fifty

Remember this pattern: we seek to all the values where PostTypeId = 2, and then apply the Bitmap as a residual predicate.

You can pretty easily mentally picture that.

Rowbot

In the row mode plan, the Nested Loops Joins are transformed to Apply Nested Loops:

SQL Server Query Plan Tool Tip
applys and oranges

Which means on the inner side of the join, both the PostTypeId and the OwnerUserId qualify as seek predicates:

SQL Server Query Plan Tool Tip
oh yeah that

Reading Rainbow


The better performance comes from doing fewer reads when indexes are accessed.

SQL Server Query Plan Tool Tip
psychic tv

Though both produce the same number of rows, the Hash Join plan in Batch Mode reads 28 million rows, or about 21 million more rows than the Nested Loop Join plan in row mode. In this case, the double seek does far fewer reads, and even Batch Mode can’t cover that up.

Part of the problem is that the optimizer isn’t psychic.

Fixing It


There are two ways I found to get the Nested Loop Join plan back.

The boring one, using a compat level hint:

SELECT u.Id, u.DisplayName, u.Reputation,
       (SELECT COUNT_BIG(*) FROM dbo.Posts AS pq WHERE pq.OwnerUserId = u.Id AND pq.PostTypeId = 1) AS q_count,
       (SELECT COUNT_BIG(*) FROM dbo.Posts AS pa WHERE pa.OwnerUserId = u.Id AND pa.PostTypeId = 2) AS a_count
FROM dbo.Users AS u
WHERE u.Reputation >= 25000
ORDER BY u.Id
OPTION(USE HINT('QUERY_OPTIMIZER_COMPATIBILITY_LEVEL_140'));

And the more fun one, rewriting the correlated subqueries as outer apply:

SELECT u.Id, u.DisplayName, u.Reputation, q_count, a_count
FROM dbo.Users AS u
    OUTER APPLY(SELECT COUNT_BIG(*) AS q_count FROM dbo.Posts AS pq WHERE pq.OwnerUserId = u.Id AND pq.PostTypeId = 1) AS q_count
    OUTER APPLY(SELECT COUNT_BIG(*) AS a_count FROM dbo.Posts AS pa WHERE pa.OwnerUserId = u.Id AND pa.PostTypeId = 2) AS a_count
WHERE u.Reputation >= 25000
ORDER BY u.Id;

Thanks for reading!

Going Further


If this is the kind of SQL Server stuff you love learning about, you’ll love my training. I’m offering a 75% discount to my blog readers if you click from here. I’m also available for consulting if you just don’t have time for that and need to solve performance problems quickly.