Signs It’s Time To Switch From ORMs To Stored Procedures In SQL Server Development

Meet Wall


There are, unfortunately, some times when developers refuse to put the ORM down.

I mean, it’s mostly unfortunate for them, because they’ll continue to have performance problems.

Me? I’ll be okay.

The items in this post are issues I’ve run into constantly when working with people who use ORMs, but don’t spend any time looking at the queries they generate.

I expect this list to grow. Heck, maybe it’ll even get some good comments that I can add to the list.

I know, I know. Good comments.

Unreasonable


Here’s the stuff I see quite frequently causing issues with ORM code, in no particular order, and they’re quite often signs that you’d be better off with a stored procedure.

1. Your select list doesn’t fit in the cached plan

Developers using ORMs often have to learn the hard way that when they poke an object, all the columns come out. Not only does the lesson seem hard to learn, the behavior seems hard to change. I’ve worked with people months and years apart and found the same bad habits over and over again, and this isn’t an exception. Not only can this hurt query performance for a number of reasons, but it also makes reproducing any issues really difficult because you can’t get the full query text easily.

2. Your queries generates long IN lists

It’s bad enough that most ORMs don’t deal gracefully with  this by parameterizing the IN clause values. Even if you do parameterize them all, SQL Server might have different ideas about how best to apply that IN clause. Scroll down to the “Complexity” section in this blog post. You can get wildly different plans depending on how many search arguments you pass in. This is one of those times where a table valued parameter, temp table, or other materialization of the list is a way better idea.

3. You don’t understand the query it generates

Because you-know-who, did you-know-what, with you-know-who, but let’s keep that between me and you isn’t a good way to send queries to SQL Server. The number of far overly-complicated queries that generate unrecognizable logic that I’ve seen have, at this point, probably generated physical weight in the world beyond mere electrons. The 20 lines of code you wrote to explain what you want have turned into a 200 line query full of derived left joins to every single imaginable relation in the database. Why? I don’t know. You don’t know either.

4. You can’t get a good query plan

You see that paragraph up there? That’s why you can’t get a good query plan. The optimizer spent a reasonable amount of time assessing all of the crazy semantic needs of your query and came up with a reasonable plan as quickly as possible. But somewhere along the line, it misjudged something, or didn’t have time to explore that one last join reordering that would have made everything okay. Or maybe, like a query that generates a long IN clause, this monster would benefit from breaking the million-layer-dip of logic up by dumping some initial results into a #temp table.

5. You can’t get developers to fully parameterize queries

When you write queries that take parameters, whether it’s a stored procedure or dynamic SQL, you get better plan re-use. When you throw literal values into the mix, the optimizer is far less charitable, and will treat each query like it has never seen it before and go about compiling a brand new execution plan for it. Even if you turn on Forced Parameterization, your semi-parameterized queries won’t be parameterized. And of course, Optimize For Ad Hoc Workloads won’t help once the plan moves beyond stub-status.

Move On


There are many ways to tune a query, but unfortunately a good portion of them are unavailable while using ORMs in their natural code-only state. Sure, you can write custom queries in the code, but that has a lot of potential downsides, too. Depending on how the code is constructed, and if parameters are strongly typed, you may not get consistent plan re-use.

I’m all for application developers using tooling that enables them to work on new features quickly and in a way that they’re comfortable with. But at some point, SQL developers or DBAs need to step in and enforce coding standards. At some point, mom and dad have to the keys away and implement something that performs beyond just what “works”.

Thanks for reading!

Going Further


If this is the kind of SQL Server stuff you love learning about, you’ll love my training. I’m offering a 75% discount to my blog readers if you click from here. I’m also available for consulting if you just don’t have time for that and need to solve performance problems quickly.

Quick SQL Server CPU Comparison Tests

Sometimes I have a need to run a quick CPU comparison test between two different SQL Server instances. For example, I might be switching from old hardware to new hardware and I want to immediately see a faster query to know that I got my money’s worth. Sometimes I get a spider sense while working with virtualized SQL Server instances and want to check for problems. Yesterday, I was doing a sort of basic health check on a few servers that I hadn’t worked with much and I wanted to verify that they got the same performance for a very simple query.

The Test Code

To get a single CPU core to 100% within SQL Server with minimal setup, the best method known to me uses a temporary procedure that does a simple operation within a WHILE loop:

CREATE OR ALTER PROCEDURE #p AS
BEGIN
    SET NOCOUNT ON;
    DECLARE @i BIGINT = 0, @time DATETIME2 = SYSUTCDATETIME();
    
    WHILE @i < 1000000
    BEGIN
        SET @i = @i + 1;
    END;
    
    SELECT cpu_time, DATEDIFF(MILLISECOND, @time, SYSUTCDATETIME()) elapsed_time
    FROM sys.dm_exec_requests
    WHERE session_id = @@SPID;
END;

GO

EXEC #p;

The code is extremely efficient (from a certain point of view) and CPU time will closely match elapsed time as as long as there’s no other processes on the lucky CPU that runs my beautiful code. It’s designed to spend as little time on waits and latches as possible. A temporary stored procedure is used to avoid ASYNC_NETWORK_IO waits. Paul White explains why the ASYNC_NETWORK_IO waits appear when the same code is run as part of a batch in this stack exchange answer.

CPU Problems

Going back to the intro, you can probably guess that I did not see identical CPU times when comparing the two servers. Otherwise, there would be no reason to write a blog post. The first server that I tested took about 2400 CPU ms to execute the code. The second server took about 300 CPU ms. There are of course a lot of factors in play here, but I would expect a healthy machine to take somewhere around 200-800 ms of CPU work. I definitely wouldn’t expect an 8X difference for two servers that were supposed to have identical performance!

To be clear, the only thing that you can safely conclude in this kind of situation is that there’s some kind of unknown configuration difference between the two servers. It does not necessarily mean that there’s some kind of severe issue with the server that takes more CPU time to perform the same work. With that said, it’s definitely suspicious and not something that you want to unexpectedly see. Running down the root cause of the issue can be difficult and time consuming because there are a lot of possible causes. Here is an incomplete list:

  • Hardware differences
  • Power plan and other OS configuration settings
  • OS patching, especially side channel vulnerability fixes
  • Enabling hyperthreading (CPU reporting within SQL server doesn’t have the same meaning)
  • Disabling Intel Turbo Boost
  • VM CPU oversubscription
  • VMware’s Enhanced vMotion Compatibility (EVC) – force a CPU to run on an older instruction set for compatibility reasons
  • Other VM issues
  • SQL Server version
  • Expensive monitoring configured within SQL Server including certain extended events, trace flags, profiling, or traces

In my case, the culprit ended up being a popular SQL Server third party monitoring solution (I will decline to name the vendor). Again, we can’t conclude that the vendor is doing something wrong. Different types of monitoring will have different overheads for different types of work within SQL Server. In some cases, simply asking for a SQL Server actual plan can more than double the execution time of a query. That doesn’t mean that we shouldn’t use actual plans as performance diagnosis tool!

Digging In

There was a fair amount of circumstantial evidence that the monitoring tool was responsible. It was running on the server with the slower code and it wasn’t running on the server with the faster code. Disabling the monitoring tool made both CPU times match. However, how can we really prove that the monitoring tool is the culprit? Where exactly is that extra CPU time going?

ETW tracing can provide a summary of call stacks during a sampled time period. Common choices are Windows Performance Recorder or PerfView. As usual, I will use PerfView. I was able to temporarily add third party monitoring to the server with the fast code. Fortunately, there wasn’t any other SQL Server work occurring during my testing so PerfView was quite effective at showing the difference between the two servers. In the image below, call stacks for slightly modified code without the monitoring tool are on the left. Call stacks for the same code with the monitoring tool present on the left are on the right:

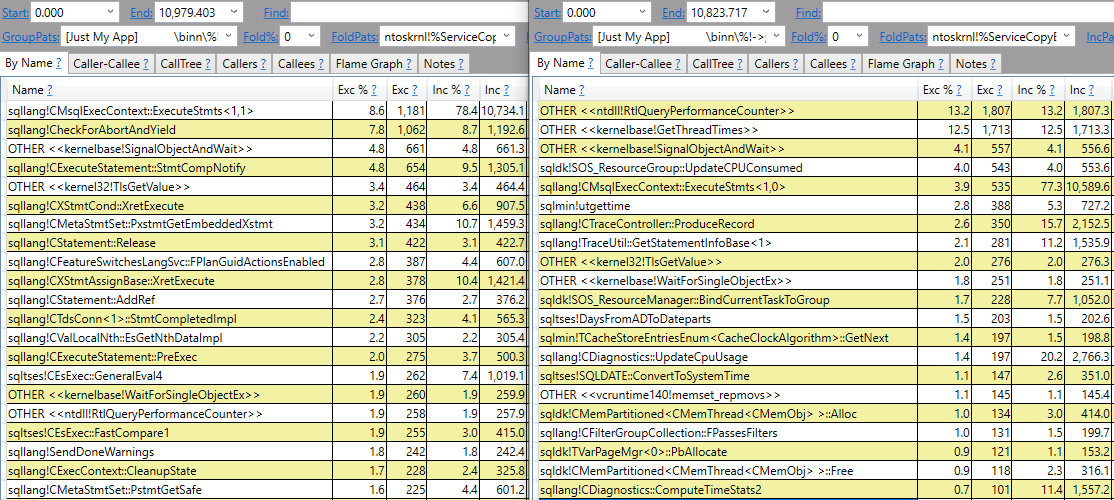
It doesn’t take a SQL Server expert to see that there are some notable differences here. I’m not an expert in SQL Server call stacks, but a lot of the stuff on the left is about what I would expect for extremely efficient code in a loop. It’s a similar feeling to those people who can identify photoshopped pictures by looking at the pixels. A lot of the stuff on the right is what I would expect if SQL Server is spending a relatively large percentage of CPU time doing monitoring, such as ntdll!RtlQueryPerformanceCounter and sqllang!TraceUtil::GetStatementInfoBase. Here’s a diff view if that makes it easier to see some of the differences:

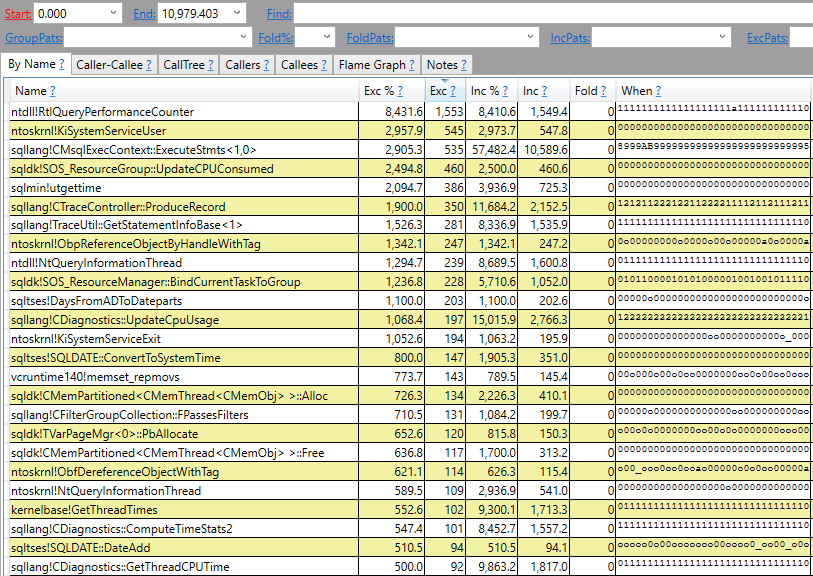
The “exc” column is the difference of the number of CPU ms spent by the method itself (not including called methods). A positive number means that the slow code spent more CPU time on that method and a negative number (not shown in this picture) means that the fast code spend more CPU time on that method.

I would describe the PerfView results as fairly conclusive evidence: the third party SQL Server monitoring tool is responsible for the 8X difference in CPU time for the WHILE loop between the two servers.

Final Thoughts

The real production workload does something more important (and complicated) than simply incrementing a variable. Seeing an 8X performance difference in that simple code wasn’t a good or welcome sign, but I expect to see a dramatic reduction in monitoring overhead when benchmarking the real workload after disabling the monitoring tool. There may not be anything to fix here, but it’s always helpful to be reminded of everything that’s running on your servers. Thanks for reading!

Why You Should Stop Looking At Query Costs In SQL Server

Spare No Expense


Over the years, there have been a lot of requests to get sp_BlitzCache to sort results by query cost. I understand why. It’s assumed that the optimizer is never wrong and that cost is directly associated with poor performance.

There are also rather misguided efforts to figure out parallelism settings based on plan costs. The main problem with that being that if you currently have a lot of parallel queries, all that means is that the estimated cost of the serial plan was higher than your current Cost Threshold For Parallelism setting, and the cost of the parallel plan was less than the cost of the serial plan.

If you increase Cost Threshold For Parallelism, you may very well still end up with a parallel plan, because the serial version was still more expensive. If you eventually change Cost Threshold For Parallelism to the point where some queries are no longer eligible for parallelism, you may eventually find yourself unhappy with the performance of the serial version of the query plan.

Albeit with less overall wait time on CX* doodads.

Next you’ll be complaining about all the SOS_SCHEDULER_YIELD waits you’ve got.

Insteads


Rather than look at estimated metrics, you should be looking at how queries actually perform. For most servers I look at, that means looking at queries with high average CPU time, and large memory grants. Those metrics typically represent tunable aspects of the query.

In other cases, you might look at wait stats to direct the type of queries you want to go after. Reads, writes, and executions are also valuable metrics at times.

One danger of looking at totals rather than averages is that you may find things that do a little bit of something a whole lot of times, and there’s no real way to tune the small bit of activity they generate other than to run the query less.

What’s A Cost For?


In general, I only tend to look at costs to figure out plan choices within a query, or when comparing two different plans for “the same” query.

This is where experimenting with hints to change the plan shapes and choices can show you why you got the plan you did, and what you might have to do to get the plan you want naturally.

Let’s say you want to figure out why you got a specific join type. You hint the type of join you want, and there’s a missing index request now. Adding the index gets you the plan shape you want without the hint. Everyone lived happily ever after.

Until the index got fragmented ???

Thanks for reading!

Going Further


If this is the kind of SQL Server stuff you love learning about, you’ll love my training. I’m offering a 75% discount to my blog readers if you click from here. I’m also available for consulting if you just don’t have time for that and need to solve performance problems quickly.

The Three Kinds Of Memory Contention In SQL Server

Savings and Loans


Whomever decided to give “memory bank” its moniker was wise beyond their years, or maybe they just made a very apt observation: all memory is on loan.

Even in the context we’ll be talking about, when SQL Server has lock pages in memory enabled, the pages that are locked in memory may not have permanent residency.

If your SQL Server doesn’t have enough memory, or if various workload elements are untuned, you may hit one of these scenarios:

  • Query Memory Grant contention (RESOURCE_SEMAPHORE)
  • Buffer Cache contention (PAGEIOLATCH_XX)
  • A mix of the two, where both are fighting over finite resources

It’s probably fair to note that not all query memory grant contention will result in RESOURCE_SEMAPHORE. There are times when you’ll have just enough queries asking for memory grants to knock a significant pages out of the plan cache to cause an over-reliance on disk without ever hitting the point where you’ve exhausted the amount of memory that SQL Server will loan out to queries.

To help you track down any of these scenarios, you can use my stored procedure sp_PressureDetector to see what’s going on with things.

Black Friday


Most servers I see have a mix of the two issues. Everyone complains about SQL Server being a memory hog without really understanding why. Likewise, many people are very proud about how fast their storage is without really understanding how much faster memory is. It’s quite common to hear someone say they they recently got a whole bunch of brand new shiny flashy storage but performance is still terrible on their server with 64GB of RAM and 1TB of data.

I recently had a client migrate some infrastructure to the cloud, and they were complaining about how queries got 3x slower. As it turned out, the queries were accruing 3x more PAGEIOLATCH waits with the same amount of memory assigned to SQL Server. Go figure.

If you’d like to see those waits in action, and how sp_PressureDetector can help you figure out which queries are causing problems, check out this video.

Market Economy


The primary driver of how much memory you need is how much control you have over the database. The less control you have, the more memory you need.

Here’s an example: One thing that steals control from you is using an ORM. When you let one translate code into queries, Really Bad Things™ can happen. Even with Perfect Indexes™ available, you can get some very strange queries and subsequently very strange query plans.

One of the best ways to take some control back isn’t even available in Standard Edition.

If you do have control, the primary drivers of how much memory you need are how effective your indexes are, and how well your queries are written to take advantage of them. You can get away with less memory in general because your data footprint in the buffer pool will be a lot smaller.

You can watch a video I recorded about that here:

Thanks for reading (and watching)!

Going Further


If this is the kind of SQL Server stuff you love learning about, you’ll love my training. I’m offering a 75% discount to my blog readers if you click from here. I’m also available for consulting if you just don’t have time for that and need to solve performance problems quickly.

Temporary Object Concurrency With In-Memory tempdb Metadata In SQL Server 2019

Moisty


Thanks for watching!

Going Further


If this is the kind of SQL Server stuff you love learning about, you’ll love my training. I’m offering a 75% discount to my blog readers if you click from here. I’m also available for consulting if you just don’t have time for that and need to solve performance problems quickly.

When Should You Use Table Variables In SQL Server? When Queries Execute Thousands Of Times A Minute

Screech


Links:

Going Further


If this is the kind of SQL Server stuff you love learning about, you’ll love my training. I’m offering a 75% discount to my blog readers if you click from here. I’m also available for consulting if you just don’t have time for that and need to solve performance problems quickly.

USE StackOverflow2013;
EXEC dbo.DropIndexes;
SET NOCOUNT ON;
DBCC FREEPROCCACHE;
GO 

CREATE INDEX whatever 
ON dbo.Posts
    (OwnerUserId) 
INCLUDE
    (Score);
GO 

CREATE OR ALTER PROCEDURE dbo.TempTableTest (@Id INT)
AS
BEGIN
SET NOCOUNT, XACT_ABORT ON;
    
    CREATE TABLE #t(i INT NOT NULL);

    INSERT 
        #t ( i )
    SELECT 
        p.Score
    FROM dbo.Posts AS p
    WHERE p.OwnerUserId = @Id;

END;
GO 

CREATE OR ALTER PROCEDURE dbo.TableVariableTest (@Id INT)
AS
BEGIN
SET NOCOUNT, XACT_ABORT ON;
    
    DECLARE @t TABLE (i INT NOT NULL);

    INSERT 
        @t ( i )
    SELECT 
        p.Score
    FROM dbo.Posts AS p
    WHERE p.OwnerUserId = @Id;

END;
GO 


CREATE OR ALTER PROCEDURE dbo.TempTestWrapper (@TestProc sysname)
AS
BEGIN
SET NOCOUNT, XACT_ABORT ON;

DECLARE @rando int = 
    ((ABS(CHECKSUM(NEWID())) % 21195018) + 1); /*this is the max id in posts for SO2013*/

IF @TestProc = N'TempTableTest'
    BEGIN
        EXEC dbo.TempTableTest @rando;
    END;

IF @TestProc = N'TableVariableTest'
    BEGIN
        EXEC dbo.TableVariableTest @rando;
    END;

END;
GO 

/*Testing*/
EXEC dbo.TempTestWrapper @TestProc = 'TempTableTest';
EXEC dbo.TempTestWrapper @TestProc = 'TableVariableTest';

/*

ostress -SSQL2019S -d"StackOverflow2013" -Q"EXEC dbo.TempTestWrapper @TestProc = 'TempTableTest';" -U"ostress" -P"ostress" -q -n300 -r1000 -o"C:\temp\crap"

ostress -SSQL2019S -d"StackOverflow2013" -Q"EXEC dbo.TempTestWrapper @TestProc = 'TableVariableTest';" -U"ostress" -P"ostress" -q -n300 -r1000 -o"C:\temp\crap"

*/

Trace Flag 8048 May Still Be Necessary After SQL Server 2016

Big Box


Way back when, SQL Servers with lots of cores could hit some weird contention on CMEMTHREAD. To fix that and a lot of other issues associated with running on a large server, people would resort to all sorts of trace flags.

My dear friend L_____ (b|t) has a list. Maybe not the most up to date list, but there are a lot of good references in the post.

Something we’ve both observed working with large servers is that Trace Flag 8048 might still be necessary under some circumstances.

Two Reasons


Starting with SQL Server 2016, it partitions memory dynamically. That’s cool.

Beats what it used to do by a country mile. Maybe even a continent mile.

But there are two problems you can run into:

  • You don’t meet the dynamic threshold, but still generate enough activity to run into contention
  • You run into issues faster than the dynamic threshold gets hit and starts taking effect

Many tools in the First Responder Kit will warn you about high CMEMTHREAD waits. You may even see them from heavy Query Store use.

If you’re running a large server, this trace flag may still be of value even after SQL Server 2016.

Thanks for reading!

Going Further


If this is the kind of SQL Server stuff you love learning about, you’ll love my training. I’m offering a 75% discount to my blog readers if you click from here. I’m also available for consulting if you just don’t have time for that and need to solve performance problems quickly.

Compressed Indexes And The Buffer Pool In SQL Server

Mail Drag


After my smash hit double diamond post about index tuning, I got a question questioning my assertion that compressed indexes are also compressed in the buffer pool.

Well, this should be quick. A quick question. Eighty hours later.

First, two indexes with no compression:

CREATE INDEX o
ON dbo.Posts
    (OwnerUserId);

CREATE INDEX l
ON dbo.Posts
    (LastEditorDisplayName);

Looking at what’s in memory:

jot’em

Now let’s create a couple indexes with compression:

CREATE INDEX o
ON dbo.Posts
    (OwnerUserId)
WITH(DATA_COMPRESSION = ROW);

CREATE INDEX l
ON dbo.Posts
    (LastEditorDisplayName)
WITH(DATA_COMPRESSION = PAGE);

I’m choosing compression based on what I think would be sensible for the datatypes involved.

For the integer column, I’m using row compression, and for the string column I’m using page compression.

got’em

Now in memory: way less stuff.

So there you go.

Thanks for reading!

Going Further


If this is the kind of SQL Server stuff you love learning about, you’ll love my training. I’m offering a 75% discount to my blog readers if you click from here. I’m also available for consulting if you just don’t have time for that and need to solve performance problems quickly.

SQL Server Queries Go Faster When They Don’t Touch Disk

A Rears


GitHub scripts

Thanks for watching!

Going Further


If this is the kind of SQL Server stuff you love learning about, you’ll love my training. I’m offering a 75% discount to my blog readers if you click from here. I’m also available for consulting if you just don’t have time for that and need to solve performance problems quickly.

Tuning I/O Is Often About Tuning Indexes In SQL Server

One Metric Ton Of Indexes


Let’s say you hate your storage. Let’s say you hate it so much that you want you SQL Serve to touch it as little as possible.

You’re most of the people I talk to. Congratulations.

But how do you do that?

Let’s talk about a few things.

How SQL Server Works With Data


It doesn’t matter if a query wants to read or modify data, all those itty-bitty little data pages need to end up in memory.

How much ends up in memory depends on how big your tables are, and how helpful your indexes are.

Likewise, the more indexes you need to modify, the more need to be in memory for that to happen.

You need to design indexes so that you can support your queries by making it easy for them to locate data. That’s your where clause, and guess what?

Your modification queries have where clauses, too.

How You Can Make Indexing Better


Make sure you’re reviewing your indexes regularly. Things that you need to keep an eye on:

  • Duplicative indexes
  • Under-utilized indexes

Even when indexes are defined on the same columns, they’re separate sets of pages within your data files.

  • If you have indexes that are on very similar sets of columns, or supersets/subsets of columns, it’s probably time to start merging them
  • If you have indexes that just aren’t being read, or aren’t being read anywhere near as much as they’re written to, you should think about ditching them

Cleaning up indexes like this gives you more breathing room to add in other indexes later.

It also gives you far fewer objects competing for space in memory.

That means the ones you have left stand a better chance of staying there, and your queries not having to go to disk for them.

How You Can Make Indexes Better


There are all sorts of things you can do to make indexes better, too. I don’t mean rebuilding them, either!

I mean getting smarter about what you’re indexing.

Things like filtered indexes and index compression can net you big wins when it comes to reducing the overall size of indexes.

My friend Andy Mallon has some Great Posts™ about compression over on his blog:

And of course, computed columns can help if you’ve got a wonky schema.

Smaller indexes that take up less space in memory make more efficient use of the space you have, which means you can fit more in there.

How You Can Make Tables Better


There are some obvious bits here, like being extra careful with choosing string length.

LOB data can lead to weird locking, and mess with memory grants.

And of course, overly-wide, non-normalized tables can also lead to issues.

If you’re running an OLTP workload, you may also want to make sure that your critical tables aren’t heaps.

Those things tend to take up more space in memory than they need to.

And of course, if you need any help fixing these types of issues, drop me a line!

Thanks for reading!

Going Further


If this is the kind of SQL Server stuff you love learning about, you’ll love my training. I’m offering a 75% discount to my blog readers if you click from here. I’m also available for consulting if you just don’t have time for that and need to solve performance problems quickly.