Detained
Despite the many metric tons of blog posts warning people about this stuff, I still see many local variables and optimize for unknown hints. As a solution to parameter sniffing, it’s probably the best choice 1/1000th of the time. I still end up having to fix the other 999/1000 times, though.
In this post, I want to show you how using either optimize for unknown or local variables makes my job — and the job of anyone trying to fix this stuff — harder than it should be.
Passenger
Like most things, we’re going to start with an index:
CREATE INDEX r ON dbo.Users(Reputation);
GO
I’m going to have a stored procedure that uses three different ways to pass a value to a where clause:
CREATE OR ALTER PROCEDURE
    dbo.u
(
    @r int,
    @u int
)
AS
BEGIN

    /* Regular parameter */
    SELECT
        c = COUNT_BIG(*)
    FROM dbo.Users AS u
    WHERE u.Reputation = @r
    AND   u.UpVotes = @u;

    /* Someone who saw someone else do it at their last job */
    DECLARE
        @LookMom int = @r,
        @IDidItAgain int = @u;

    SELECT
        c = COUNT_BIG(*)
    FROM dbo.Users AS u
    WHERE u.Reputation = @LookMom
    AND   u.UpVotes = @IDidItAgain;

    /* Someone who read the blog post URL wrong */
    SELECT
        c = COUNT_BIG(*)
    FROM dbo.Users AS u
    WHERE u.Reputation = @r
    AND   u.UpVotes = @u
    OPTION(OPTIMIZE FOR UNKNOWN);

END;
GO
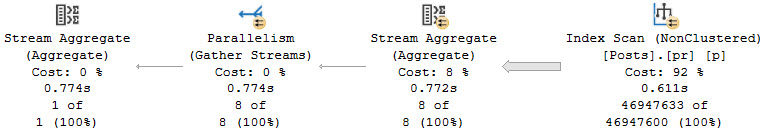
First Way
The best case is we run this for a small number of rows, and no one really notices. Even though we get bad guesses for the second two queries, it’s not a huge deal.
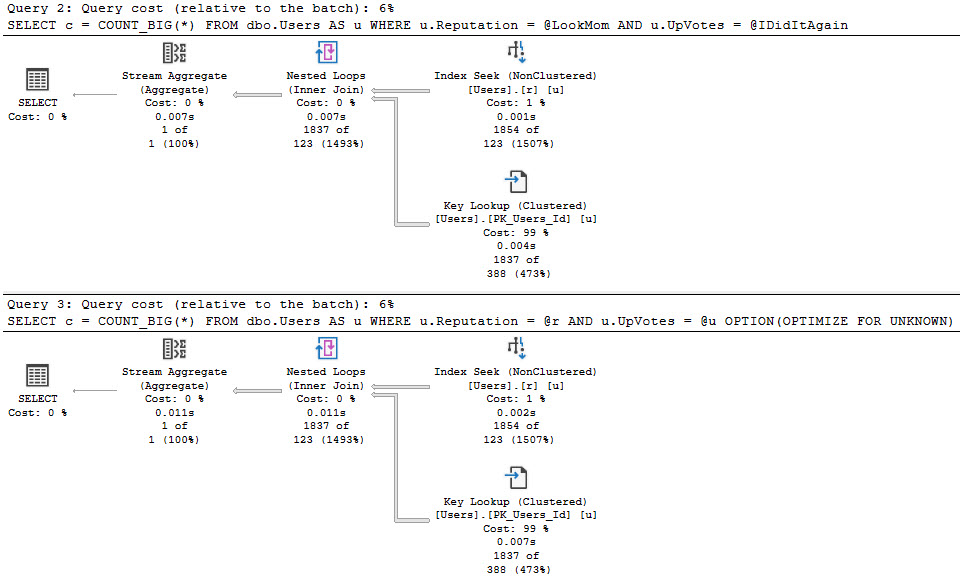
When you run procs like this, SQL Server doesn’t cache the compile time values the same way it does when you use parameters. Granted, this is because it technically shouldn’t matter, but if you’re looking for a way to execute the proc again to reproduce the issue, it’s up to you to go figure out what someone did.
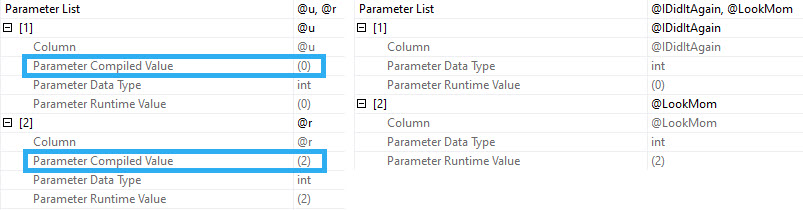
Since I’m getting the actual plans here, I get the runtime values for both, but those don’t show up in the plan cache or query store version of plans.
That’s typically a huge blind spot when you’re trying to fix performance issues of any kind, but it’s up to you to capture that stuff.
Just, you know, good luck doing it in a way that doesn’t squash performance.
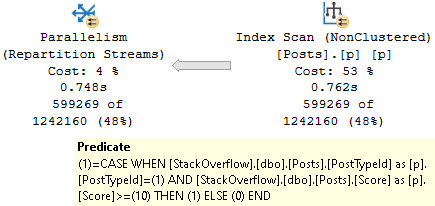
Second Way
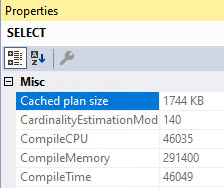
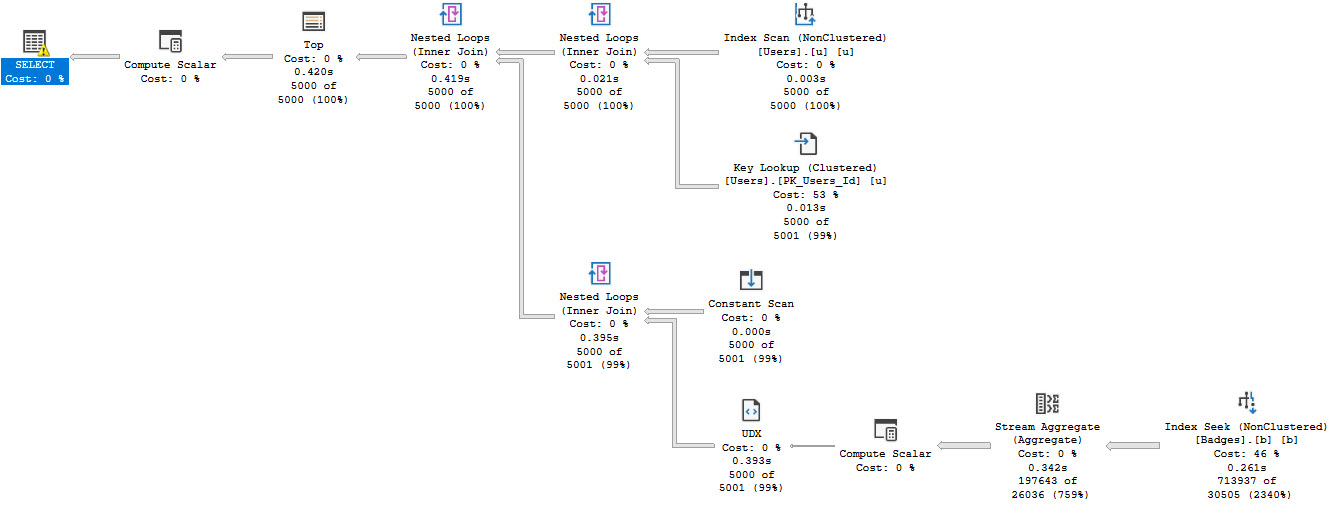
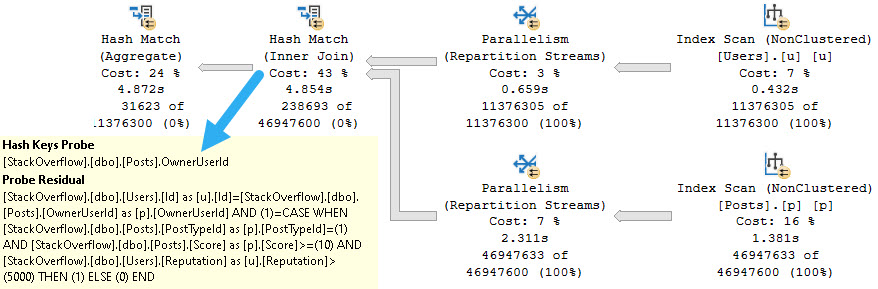
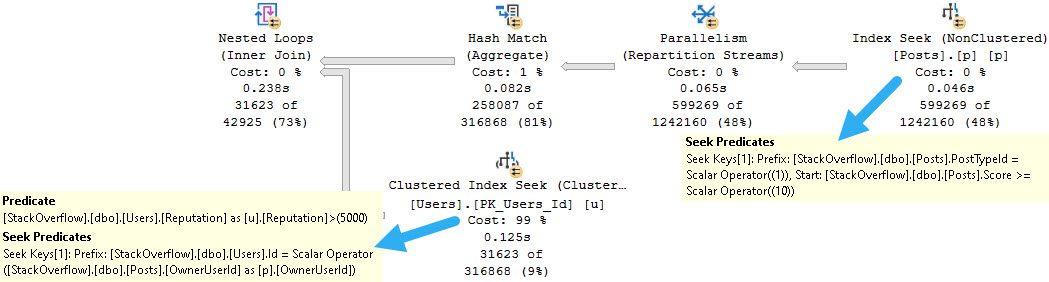
In this example, our index is only on the Reputation column, but our where clause is also on the UpVotes column.
In nearly every situations, it’s better to have your query do all the filtering it can from one index source — there are obviously exceptions — but the point here is that the optimizer doesn’t bother with a missing index request for the second two queries, only for the first one.
That doesn’t matter a ton if you’re looking at the query and plan right in front of you, but if you’re also using the missing index DMVs to get some idea about how useful overall a new index might be, you’re out of luck.
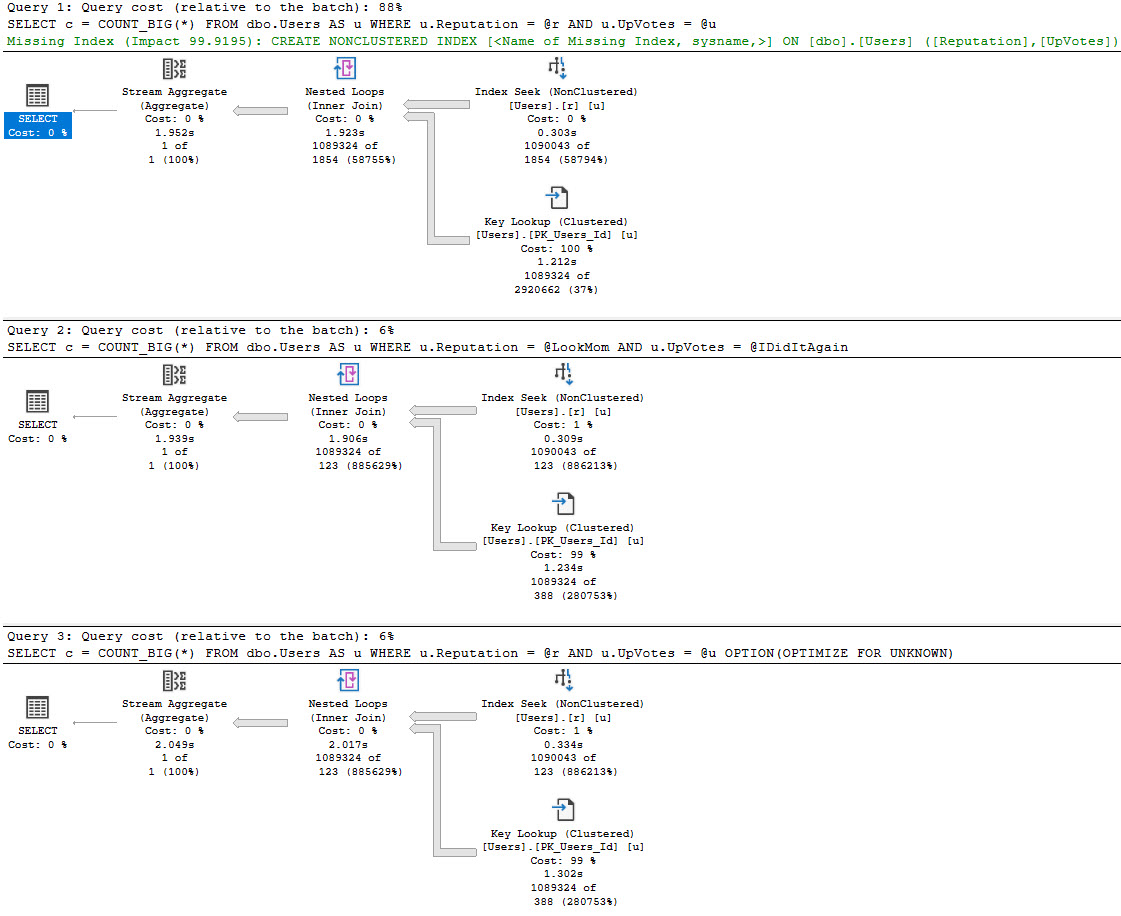
In this case, the optimizer doesn’t think the second two plans are costly enough to warrant anything, but it does for the first plan.
I’m not saying that queries with local variables or optimize for unknown hints always do this, or that parameterized plans will always ask for (good) indexes. There are many issues with costing and SARGability that can prevent them from showing up, including getting a trivial plan.
This is just a good example of how Doing Goofy Things™ can backfire on you.
Thanks for reading!
Going Further
If this is the kind of SQL Server stuff you love learning about, you’ll love my training. I’m offering a 75% discount to my blog readers if you click from here. I’m also available for consulting if you just don’t have time for that and need to solve performance problems quickly.