Join Me At Data Platform Summit 2020!

The Road From Nowhere


This year, I’m teaching an 8 hour online workshop at Data Platform Summit, and I’d love it if you joined me.

Here’s what I’ll be teaching:

Class Title: The Beginner’s Guide To Advanced Performance Tuning

Abstract: You’re new to SQL Server, and your job more and more is to fix performance problems, but you don’t know where to start.

You’ve been looking at queries, and query plans, and puzzling over indexes for a year or two, but it’s still not making a lot of sense.

Beyond that, you’re not even sure how to measure if your changes are working or even the right thing to do.

In this full day performance tuning extravaganza, you’ll learn about all the most common anti-patterns in T-SQL querying and indexing, and how to spot them using execution plans. You’ll also leave knowing why they cause the problems that they do, and how you can solve them quickly and painlessly.

If you want to gain the knowledge and confidence to tune queries so they’ll never be slow again, this is the training you need.

Date: Dec 7 & 8.

Time: 12 PM to 04 PM EST (View in your timezone)

Tickets: Tickets here!

Going Further


If this is the kind of SQL Server stuff you love learning about, you’ll love my training. I’m offering a 75% discount to my blog readers if you click from here. I’m also available for consulting if you just don’t have time for that and need to solve performance problems quickly.

Which Parallel Deadlocks Produce Deadlock Graphs In SQL Server?

Sadness


There are two types of parallel deadlocks. The kind that end in an error message, and the kind that are resolved by exchanges spilling buffers.

It used to be that both kinds would produce deadlock graphs. Microsoft even added some additional troubleshooting information specifically for them.

But apparently that had some overhead, and parallel deadlocks for exchange spills got pulled from the equation.

I checked back to SQL Server 2012 and 2014 on their respective latest service packs, and they both still capture deadlock graphs for exchange spills.

There have been some CUs since Sp3 for SQL Server 2014, but they don’t mention anything about this being backported in them.

Why Is This A Big Deal?


If you were digging into query performance issues, or if you were capturing deadlocks somehow, you used to be able to find queries with these problems pretty easily.

In the article that describes a fix for many deadlock reports, Microsoft offers up an alternative Extended Event session to capture queries that produce error 1205 (a deadlock), but I wasn’t able to get that to capture deadlocks that were resolved by exchange spills.

I don’t think they actually produce that error, which is also why they don’t produce a deadlock graph.

Why they did that when there is, quite not-figuratively, an event dedicated to capturing exchange spills, is beyond me.

i mean really

For me personally, it was a bit of a curveball for sp_BlitzLock. The XML that got produced for exchange spill deadlocks has different characteristics from the ones that produce errors.

There’s a lot of stuff that isn’t documented, too.

Change It Back?


I’m assuming there was some technical challenge to producing a single deadlock graph for exchange spills, which is why it got pulled instead of fixed.

Normally I’d think about opening a UserVoice item, but it doesn’t seem like it’d go anywhere.

There’s enough good ideas on there now that haven’t seen any traction or attention.

Anyway, if you’re on a newer version of SQL Server, take note of the change if you’re troubleshooting this sort of thing.

Thanks for reading!

Going Further


If this is the kind of SQL Server stuff you love learning about, you’ll love my training. I’m offering a 75% discount to my blog readers if you click from here. I’m also available for consulting if you just don’t have time for that and need to solve performance problems quickly.

Options For Fixing Parallel Query Deadlocks In SQL Server

Recreating


If you have a copy of the StackOverflow2013 database, this query should produce a parallel deadlock.

SELECT c.Id, c.UserId, c.CreationDate, c.PostId, c.Score 
INTO #ohno 
FROM dbo.Comments AS c WITH (TABLOCKX);

If you want an easy way to track down deadlocks, I can’t recommend sp_BlitzLock enough.

It doesn’t render the deadlock graph for you, but it does get you the deadlock XML, which you can save as an XDL file.

For viewing them, Sentry One’s Plan Explorer tool is way better than SSMS. It doesn’t just explore plans — it also explores deadlocks.

Graphed Out


The way it’ll look is something like this:

SQL Server Deadlock
ow my face

You’ll see the exchange event, and you’ll also see the same query deadlocking itself.

This is an admittedly odd situation, but one I’ve had to troubleshoot a bunch of times.

You might see query error messages something like this:

Msg 1205, Level 13, State 18, Line 3
Transaction (Process ID 55) was deadlocked on lock | communication buffer resources with another process and has been chosen as the deadlock victim. Rerun the transaction.

Options For Fixing It


If you start running into these, it can be for a number of reasons, but the root cause is a parallel query. That doesn’t mean you should change MAXDOP to 1, though you should check your parallelism settings to make sure they’re not at the defaults.

You may want to try setting the query you’re having a problem with to DOP 1. Sure, performance might suffer, but at least it won’t error out.

If that’s not possible, you might need to look at other things in the query. For example, you might be missing a helpful index that would make the query fast without needing to go parallel.

Another issue you might spot in query plans is around order preserving operators. I wrote a whole bunch about that with an example here. You might see it around operators like Sorts, Merges, and Stream Aggregates when they’re surrounding parallel exchange operators. In those cases, you might need to hint HASH joins or aggregations.

Thanks for reading!

Going Further


If this is the kind of SQL Server stuff you love learning about, you’ll love my training. I’m offering a 75% discount to my blog readers if you click from here. I’m also available for consulting if you just don’t have time for that and need to solve performance problems quickly.

Encouraging Parallelism In SQL Server Nested Loops Join Query Plans

‘Splainin


When you run a query, the optimizer has a lot to think about. One of those things is if the plan will benefit from parallelism.

That generally happens as long as:

  • The plan isn’t trivial — it has to receive full optimization
  • Nothing is artificially inhibiting parallelism (like scalar functions or table variable modifications)
  • If the serial plan cost is greater than the Cost Threshold For Parallelism (CTFP)

As long as all those qualifications are met, the optimizer will come up with competing parallel plans. If it locates a parallel plan that’s cheaper than the serial plan, it’ll get chosen.

This is determined at a high level by adding up the CPU and I/O costs of each operator in the serial plan, and doing the same for the parallel plan with the added costs of one or more parallel exchanges added in.

Yesterday we saw a case where the Gather Streams operator was costed quite highly, and it prevented a parallel plan from being chosen, despite the parallel plan in this case being much faster.

It’s important to note that costing for plans is not a direct reflection of actual time or effort, nor is it accurate to your local configuration.

They’re estimates used to come up with a plan. When you get an actual plan, there are no added-in “Actual Cost” metrics.

How Nested Loops Is Different


In merge or hash join plans, both sides of the join are part of the costing algorithm to decide if parallelism should be engaged.

An example with a hash join:

SQL Server Query Plan
parallel: 4.7 CPU query bucks


SQL Server Query Plan
seriallel: 18.8 CPU query bucks

The estimated CPU cost of scanning the Posts table is reduced by 14 or so query bucks. The I/O cost doesn’t change at all.

In this case, it results in a parallel plan being naturally chosen, because the overall plan cost for the parallel plan is cheaper.

For Nested Loops, it’s different:

SQL Server Query Plan
parallel: 18.8 CPU query bucks


SQL Server Query Plan
seriallel: 18.8 CPU query bucks

Slashing Prices


In Nested Loops plans, only the stuff on the outer side of the join experiences a cost reduction by engaging parallelism.

That means that if you’ve got a plan shaped like this that you need to go parallel, you need to figure out how to make the outside as expensive on CPU as possible.

In a lot of cases, you can use ORDER BY to achieve this because it can introduce a Sort operator into the query plan.

Of course, where that Sort operator ends up can change things.

For example, if I ask to order results by Reputation here:

SELECT u.Id, 
       u.DisplayName, 
       u.Reputation, 
       ca.Id, 
       ca.Type, 
       ca.CreationDate,
       ca.Text --Text in the select list
FROM dbo.Users AS u
OUTER APPLY
(
SELECT c.Id,
       DENSE_RANK() 
           OVER ( PARTITION BY c.PostId 
                  ORDER BY c.Score DESC ) AS Type,
        c.CreationDate,
        c.Text
FROM dbo.Comments AS c
WHERE c.UserId = u.Id
) AS ca
WHERE ca.Type = 0
ORDER BY u.Reputation DESC;

The Sort ends up before the join, and only applies to relatively few rows, and the plan stays serial.

SQL Server Query Plan
boing

But if I ask for something from inside of the cross apply to be ordered, the number of rows the optimizer expects to have to sort increases dramatically, and so does the cost.

SELECT u.Id, 
       u.DisplayName, 
       u.Reputation, 
       ca.Id, 
       ca.Type, 
       ca.CreationDate,
       ca.Text --Text in the select list
FROM dbo.Users AS u
OUTER APPLY
(
SELECT c.Id,
       DENSE_RANK() 
           OVER ( PARTITION BY c.PostId 
                  ORDER BY c.Score DESC ) AS Type,
        c.CreationDate,
        c.Text
FROM dbo.Comments AS c
WHERE c.UserId = u.Id
) AS ca
WHERE ca.Type = 0
ORDER BY ca.CreationDate DESC;
SQL Server Query Plan
beachfront

The additional cost on the outer side tilts the optimizer towards a parallel plan.

There’s No Such Thing As A Free Cool Trick™


This, of course, comes at a cost. While you do gain efficiency in the query finishing much faster, the Sort operator asks for a nightmare of memory.

SQL Server Query Plan
O HEK

If you have ~10GB of memory to spare for a memory grant, cool. This might be great.

Of course, there are other ways to control memory grants via hints and resource governor, etc.

In some cases, adding an index helps, but if we do that then we’ll lose the added cost and the parallel plan.

Like most things in life, it’s about tradeoffs.

Thanks for reading!

Going Further


If this is the kind of SQL Server stuff you love learning about, you’ll love my training. I’m offering a 75% discount to my blog readers if you click from here. I’m also available for consulting if you just don’t have time for that and need to solve performance problems quickly.

How String Data Can Hurt Query Performance In SQL Server

Mistakes!


Strings cause nothing but problems in databases.

  • Standard vs. Unicode
  • Odd collations
  • Inflated memory grants
  • Oversized columns because of truncation
  • String splitting

And of course, sometimes they can cause plans to be costed strangely.

Strong Tradition


Working with the queries we’ve been tinkering with in all the posts this week, let’s look at a slightly different oddity.

/*Q1*/
SELECT u.Id, 
       u.DisplayName, 
       u.Reputation, 
       ca.Id, 
       ca.Type, 
       ca.CreationDate,
       ca.Text --Text in the select list
FROM dbo.Users AS u
OUTER APPLY
(
SELECT c.Id,
       DENSE_RANK() 
           OVER ( PARTITION BY c.PostId 
                  ORDER BY c.Score DESC ) AS Type,
        c.CreationDate,
        c.Text
FROM dbo.Comments AS c
WHERE c.UserId = u.Id
) AS ca
WHERE ca.Type = 0;


/*Q2*/
SELECT u.Id, 
       u.DisplayName, 
       u.Reputation, 
       ca.Id, 
       ca.Type, 
       ca.CreationDate
       -- No Text in the select list
FROM dbo.Users AS u
OUTER APPLY
(
SELECT c.Id,
       DENSE_RANK() 
           OVER ( PARTITION BY c.PostId 
                  ORDER BY c.Score DESC ) AS Type,
        c.CreationDate,
        c.Text
FROM dbo.Comments AS c
WHERE c.UserId = u.Id
) AS ca
WHERE ca.Type = 0;

The first query has the Text column in the outer select list, and the second query doesn’t. Please read the comments for additional clarity.

Big Plans


The plan without Text in the outer project goes parallel, and the one with it does not.

SQL Server Query Plan
pain pain

But why?

Forcing The Issue


Let’s add a third query into the mix to force the query to go parallel.

/*Q3*/
SELECT u.Id, 
       u.DisplayName, 
       u.Reputation, 
       ca.Id, 
       ca.Type, 
       ca.CreationDate,
       ca.Text --Text in the select list
FROM dbo.Users AS u
OUTER APPLY
(
SELECT c.Id,
       DENSE_RANK() 
           OVER ( PARTITION BY c.PostId 
                  ORDER BY c.Score DESC ) AS Type,
        c.CreationDate,
        c.Text
FROM dbo.Comments AS c
WHERE c.UserId = u.Id
) AS ca
WHERE ca.Type = 0
OPTION(USE HINT('ENABLE_PARALLEL_PLAN_PREFERENCE'));

Things are pretty interesting, here.

SQL Server Query Plan
caloric surplus

The parallel plan is actually costed cheaper up through the Filter operator. In the serial plan, the entire subtree costs 35,954. In the parallel plan, it’s at 35,719.

At 200 query bucks cheaper, we’re in good shape! And then… We Gather Streams ☹

SQL Server Query Plan
creaky french

Mortem


The Gather Streams pushes the final plan cost for the parallel plan up higher than the serial plan.

Even though the parallel plan finishes ~26 seconds faster, the optimizer doesn’t choose it naturally because it is a cheapskate.

Bummer, huh?

An important point to keep in mind is that in nested loops join plans, the inner side of the query doesn’t receive any cost adjustments for parallel vs. serial versions. All of the costing differences will exist on the outside.

That’s why only the last few operators in the plan here are what makes a difference.

And that’s what we’ll finish out the week with!

Thanks for reading!

Going Further


If this is the kind of SQL Server stuff you love learning about, you’ll love my training. I’m offering a 75% discount to my blog readers if you click from here. I’m also available for consulting if you just don’t have time for that and need to solve performance problems quickly.

Please Stop Ignoring CXCONSUMER Waits In SQL Server

I’m Begging You, Here


Ever since SSMS started collecting wait stats in query plans, I’ve been mad about a couple things that get filtered out:

  • Lock waits
  • CXCONSUMER waits

Lock waits are particularly annoying. Imagine (I know, this might be difficult) that you have a friend who is puzzled by why a query is sometimes slow.

They send you an actual plan for when it’s fast, and an actual plan for when it’s slow. You compare them in every which way, and everything except duration is identical.

It’d be a whole lot easier to answer them if LCK waits were collected, but hey. Let’s just make them jump through another hoop to figure out what’s going on.

CXCONSUMER has a similar problem — and here’s the thing — if people are going through the trouble of collecting this information, give’em what they ask for. Don’t just give them what you think is a good idea.

Highly Affected People


Let’s look at a query where parallelism all gets skewed to one thread.

SELECT u.Id, 
       u.DisplayName, 
       u.Reputation, 
       u.CreationDate, 
       ca.*
FROM dbo.Users AS u
OUTER APPLY
    (
        SELECT *, 
        DENSE_RANK() 
              OVER( PARTITION BY vs.Id 
                    ORDER BY vs.Id DESC ) AS whatever
        FROM dbo.VotesSkewed AS vs
        WHERE vs.UserId = u.Id
        AND   vs.VoteTypeId BETWEEN 1 AND 4
    ) AS ca
WHERE ca.whatever = 0;

It runs for 42 seconds!

SQL Server Query Plan
slowpoke

But the only wait collected is SOS_SCHEDULER_YIELD. For 392 ms.

SQL Server Query Plan
o okay

Different Angle


If we watch the server’s wait stats while the query runs, we see a totally different story.

EXEC sp_BlitzFirst @Seconds = 50, @ExpertMode = 1;
SQL Server Query plan
uh huh

We had four waits on CXCONSUMER that all lasted nearly 11 seconds. Which of course happens because all the rows end up on one thread.

SQL Server Query Plan
bumpin

Sure, that’s easy enough to spot if you go looking, but having CXCONSUMER waits collected would make it a whole lot easier to know what to look for.

That is surely a significant enough wait to include. And don’t tell me it’s not actionable, because I spend a good chunk of time fixing problems like this.

Thanks for reading!

Going Further


If this is the kind of SQL Server stuff you love learning about, you’ll love my training. I’m offering a 75% discount to my blog readers if you click from here. I’m also available for consulting if you just don’t have time for that and need to solve performance problems quickly.

Starting SQL: Why Your SQL Server Query Can’t Go Parallel, Scalar Functions Edition

I Won’t Share You


Yesterday we looked at where table variables can have a surprising! impact on performance. We’ll talk more about them later, because that’s not the only way they can stink. Not by a long shot. Even with 1 row in them.

Anyway, look, today’s post is sort of like yesterday’s post, except I’ve had two more drinks.

What people seem to miss about scalar valued functions is that there’s no distinction between ones that touch data and ones that don’t. That might be some confusion with CLR UDFs, which cause parallelism issues when they access data.

Beans and Beans


What I want to show you in this post is that it doesn’t matter if your scalar functions touch data or not, they’ll still have similar performance implications to the queries that call them.

Now look, this might not always matter. You could just use a UDF to assign a value to a variable, or you could call it in the context of a query that doesn’t do much work anyway. That’s probably fine.

But if you’re reading this and you have a query that’s running slow and calling a UDF, it just might be why.

  • If the UDF queries table data and is inefficient
  • If the UDF forces the outer query to run serially

They can be especially difficult on reporting type queries. On top of forcing them to run serially, the functions also run once per row, unlike inline-able constructs.

Granted, this once-per-row thing is worse for UDFs that touch data, because they’re more likely to encounter the slings and arrows of relational data. The reads could be blocked, or the query in the function body could be inefficient for a dozen reasons. Or whatever.

I’m Not Touching You


Here’s a function that doesn’t touch anything at all.

CREATE OR ALTER FUNCTION dbo.little_function (@UserId INT)
RETURNS BIGINT
WITH SCHEMABINDING, 
     RETURNS NULL ON NULL INPUT
AS
BEGIN
DECLARE @d DATETIME = GETDATE();
RETURN
(
    ( 
      SELECT @UserId
    )
)
END
GO

I have the declared variable in there set to GETDATE() to disable UDF inlining in SQL Server 2019.

Yes, I know there’s a function definition to do the same thing, but I want you to see just how fragile a feature it is right now. Again, I love where it’s going, but it can’t solve every single UDF problem.

Anyway, back to the story! Let’s call that function that doesn’t do anything in our query.

SELECT TOP (1000) 
    c.Id,
    dbo.little_function(c.UserId)
FROM dbo.Comments AS c
ORDER BY c.Score DESC;

The query plan looks like so, with the warning in properties about not being able to generate a valid parallel plan.

what’s so great about you?

In this plan, we see the same slowdown as the insert to the table variable. There’s no significant overhead from the function, it’s just slower in this case because the query is forced to run serially by the function.

This is because of the presence of a scalar UDF, which can’t be inlined in 2019. The serial plan represents, again, a significant slowdown over the parallel plan.

Bu-bu-bu-but wait it gets worse


Let’s look at a worse function.

CREATE OR ALTER FUNCTION dbo.big_function (@UserId INT)
RETURNS BIGINT
WITH SCHEMABINDING, 
     RETURNS NULL ON NULL INPUT
AS
BEGIN
DECLARE @d DATETIME = GETDATE();
RETURN
(
    ( 
      SELECT SUM(p.Score)
      FROM dbo.Posts AS p
      WHERE p.OwnerUserId = @UserId
    ) - 
    (
      SELECT SUM(c.Score)
      FROM dbo.Comments AS c
      WHERE c.UserId = @UserId
    )
)
END
GO

Not worse because it’s a different kind of function, just worse because it goes out and touches tables that don’t have any helpful indexes.

Getting to the point, if there were helpful indexes on the tables referenced in the function, performance wouldn’t behave as terribly. I’m intentionally leaving it without indexes to show you a couple funny things though.

Because this will run a very long time with a top 1000, I’m gonna shorten it to a top 1.

SELECT TOP (1) 
    c.Id,
    dbo.big_function(c.UserId)
FROM dbo.Comments AS c
ORDER BY c.Score DESC;

Notice that in this plan, the compute scalar takes up a more significant portion of query execution time. We don’t see what the compute scalar does, or what the function itself does in the actual query plan.

got yourself a function

The compute scalar operator is what’s responsible for the scalar UDF being executed. In this case, it’s just once. If I had a top that asked for more than one row, It would be responsible for more executions.

We don’t see the function’s query plan in the actual query, because it could generate a different query plan on each execution. Would you really want to see 1000 different query plans?

Anyway, it’s quite easy to observe with operator times where time is spent here. Most people read query plans from right to left, and that’s not wrong.

In that same spirit, we can add operator times up going from right to left. Each operator not only account for its own time, but for the time of all operators that come before it.

The clustered index scan takes 7.5 seconds, the Sort takes 3.3 seconds, and the compute scalar takes 24.9 seconds. Wee.

Step Inside


If you get an actual plan for this query, you won’t see what the function does. If you get an estimated plan, you can get a picture of what the function is up to.

monster things

This is what I meant by the function body being allowed to go parallel. This may lead to additional confusion when the calling query accrues parallel query waits but shows no parallel operators, and has a warning that a parallel plan couldn’t be generated.

hi my name is

It’s Not As Funny As It Sounds


If you look at a query plan’s properties and see a non-parallel plan reason, table variable modifications and scalar UDFs will be the most typical cause. They may not always be the cause of your query’s performance issues, and there are certainly many other local factors to consider.

It’s all a bit like a game of Clue. You might find the same body in the same room with the same bashed in head, but different people and blunt instruments may have caused the final trauma.

Morbid a bit, sure, but if query tuning were always a paint by numbers, no one would stay interested.

Anyway.

In the next posts? we’ll look at when SQL Server tells you it needs an index, and when it doesn’t.

Thanks for reading!

Going Further


If this is the kind of SQL Server stuff you love learning about, you’ll love my training. I’m offering a 75% discount to my blog readers if you click from here. I’m also available for consulting if you just don’t have time for that and need to solve performance problems quickly.

Starting SQL: Compensating For CPU Waits In SQL Server

Fast Car


Some waits relate, but nearly all waits can be compensated for.

It’s all pulling levers, really. The Great And Powerful Oz has nothing on SQL Server.

More to the point, you can end up in quite a tangle with wait stats. I see people get bogged down in one or two metrics that they read are they worst thing you can ever see on a SQL Server, only to have them be totally unrelated to the problem at hand.

Go figure, the internet misled someone. At some point, this post will probably be misleading too. It might even be misleading right now.

Let’s talk about how to compensate for the common waits we talked about yesterday.

CXPACKET and CXCONSUMER


The fastest answer here is to check your settings. If these are at the defaults, you’re messing up. There’s a lot of competing points of view about how to set parallelism settings in SQL Server. The thing is, any of it can be wrong.

I don’t want to write this and have you think what I say is set in concrete. I want you to understand that I’m giving you a starting point, and it’s going to be up to you to figure out where to go from here.

MAXDOP (Max Degree Of Parallelism)

This is a fun one, because of the number of misconceptions around it. Here’s the way I go about it.

  • If you have one NUMA node with <= 8 cores, you can probably leave it alone, though sometimes I’ll set it to 4 on a server with 8 cores (like my laptop, ha ha ha) if the server is in tough shape
  • If you have one NUMA node with > 8 cores, set it to 8
  • If you have more than one NUMA node with <= 8 cores, set it to the number of cores in a NUMA node
  • If you have more than one NUMA node with > 8 cores, set it to 8

Will this work perfectly for everyone? No, but it’s a better starting place than 0. There are even some maintenance tasks that you might want to run with higher or lower MAXDOP, but that’s way beyond anything I want to get into here.

Plus, there’s all sorts of oddball CPU configurations that you can see, either because your VM admin has a permanent vape cloud around their head, or because some newer CPUs have non-traditional core counts that don’t follow the power of 2 increases (2, 4, 8, 16, 32, 64…) that CPUs have generally used.

If you leave MAXDOP set to 0, parallel queries can team up and really saturate your CPUs, especially if you don’t change…

CTFP (Cost Threshold For Parallelism)

The default for this is 5. This does not mean seconds. It meant seconds on one computer in the late 90s, but not anymore. I’d link to the post that talked about that one computer, but Microsoft nuked the blog it was on. Thanks, Microsoft.

It’s probably important for you not to have to think about all those old blogs when you’re concentrating so hard on quality CUs and documentation.

For everyone now, they’re sort of like Monopoly money. They don’t mean anything relative to your hardware. It’s not like weight, where you weigh different amounts based on the amount of gravity in your environment. These costs are only meaningful to the optimizer in coming up with plan choices.

Thing is, it’s really easy for a query to cost more than 5 of these whatevers. What’s important to understand up front is how this number is used.

When the optimizer gets a query that it needs to come up with an execution plan for, the first thing it comes up with is a serial execution plan. If the cost of that serial plan is over the CTFP threshold, the optimizer will consider parallel plans (assuming nothing is preventing a parallel plan from being formed, like scalar functions, etc).

If the cost of the parallel plan is cheaper than the cost of the serial plan then SQL Server will go with that one. I’m gonna put this in bold, because it’s a question I answer all the time: The cost of a parallel plan does not have to be higher than CTFP.

Setting Cost Threshold For Parallelism

Well, okay then. This seems important to set correctly. If you have to start somewhere, 50 is a nice number. Do you have to leave it there? No, but just like MAXDOP, it’s a setting you’ll wanna tweak after some observations.

Most importantly, if critical queries got slower after making changes. If they did, we need to figure out if it’s because they either stopped going parallel, or stopped having a higher available degree of parallelism available to them.

Some people will tell you to look at the query costs in your plan cache to figure out what to set this to, but there are some really big problems with that advice: your plan cache could be really unstable, your plan cache could not have plans that are a good representation of your workload, and query plans lie.

Most of that goes for Query Store, too. Even though it theoretically has more history, it’s up to you to sift through everything in there to find the queries you care about trying to get MAXDOP right for.

Sure, it’s nice if those CX waits go down when you make changes, since that’s what the settings we talked about most closely control. But there’s a more important wait that changing these can help limit, too.

THREADPOOL


This is a wait you generally only want to see in demos done by professionals.

Why? Because it means SQL Server ran out of worker threads to give to queries so that they can run. It’s a really bad situation, because you might have a hard time figuring out what’s wrong.

  • You might not be able to connect to your SQL Server
  • Your monitoring tool might not be able to connect to your SQL Server

On top of that, your applications might not be able to connect, and even RDP connections might fail. You can mitigate some amount of THREADPOOL incidents by MAXDOP and CTFP correctly. Fewer queries going parallel, and perhaps going parallel to a lesser degree can reduce the number of worker threads that a workload consumes.

But just doing that can’t fix everything. If you just plain have a higher degree of concurrency than your hardware can handle, or if queries are stacking up because of issues with blocking, you still run the risk of this happening. You might need to add hardware or do significant query and index tuning to fix the problem completely.

And no, setting MAXDOP to 1 isn’t a viable solution.

Thanks for reading!

Going Further


If this is the kind of SQL Server stuff you love learning about, you’ll love my training. I’m offering a 75% discount to my blog readers if you click from here. I’m also available for consulting if you just don’t have time for that and need to solve performance problems quickly.

Using Exchange Demand Partitioning to Improve Parallel Query Scalability In SQL Server

One of our SQL Server workloads runs many concurrent parallel queries on a possibly already busy server. Other work occurring on the server can have dramatic effects on parallel query runtimes. One way to improve scalability of parallel query runtimes is to achieve query plans with operators that allow a dynamic amount of work to be completed by each parallel worker thread. For example, exchange operators with a partitioning type of hash or round robin force a typically even amount of work to be completed by each worker thread. If a worker thread happens to be on a busy scheduler then query runtime may increase due to the longer runtime of the worker thread that is competing for CPU resources. Serial zones in parallel query plans can of course have the same problem. Batch mode operators, exchange operators with a partitioning type of broadcast or demand, and the parallel page supplier are all examples of operators which can do a dynamic amount of work per thread. Those are the operators that I prefer to see in query plans for this workload.

Very little has been written about exchange operators with a partitioning type of demand, so I forgive you for not hearing of it before today. There is a brief explanation available here, an example of using demand partitioning to improve some query plans involving partitioned tables, and a Stack Exchange answer for someone comparing round robin and demand partitioning. You have the honor of reading perhaps the fourth blog post about the subject.

Start


The demos are somewhat dependent on hardware so you may not see identical results if you are following along. I’m testing on a machine with 8 CPU and with max server memory was set to 6000 MB. Start with a table with a multi-column primary key and insert about 34 million rows into it:

DROP TABLE IF EXISTS #;
CREATE TABLE # (
ID BIGINT NOT NULL,
ID2 BIGINT NOT NULL,
STRING_TO_AGG VARCHAR(MAX),
PRIMARY KEY (ID, ID2)
);

INSERT INTO # WITH (TABLOCK)
SELECT RN, v.v, REPLICATE('REPLICATE', 77)
FROM (
SELECT TOP (4800000) ROW_NUMBER() OVER (ORDER BY (SELECT NULL)) RN
FROM master..spt_values
CROSS JOIN master..spt_values t2
) q
CROSS JOIN (VALUES (1), (2), (3), (4), (5), (6), (7)) v(v);

The query tuning exercise is to insert the ID column and a checksum of the concatenation of all the STRING_TO_AGG values for each ID value ordered by ID2. This may seem like an odd thing to do but it is based upon a production example with an adjustment to not write as much data as the real query. Not all of us have SANs in our basements, or even have a basement. Use the following for the target table:

DROP TABLE IF EXISTS ##;

CREATE TABLE ## (
ID BIGINT NOT NULL,
ALL_STRINGS_CHECKSUM INT
);

Naturally we use SQL Server 2019 CU4 so the STRING_AGG function is available to us. Here is one obvious way to write the query:

INSERT INTO ## WITH (TABLOCK)
SELECT ID, CHECKSUM(STRING_AGG(STRING_TO_AGG , ',') WITHIN GROUP (ORDER BY ID2))
FROM #
GROUP BY ID
OPTION (MAXDOP 8);

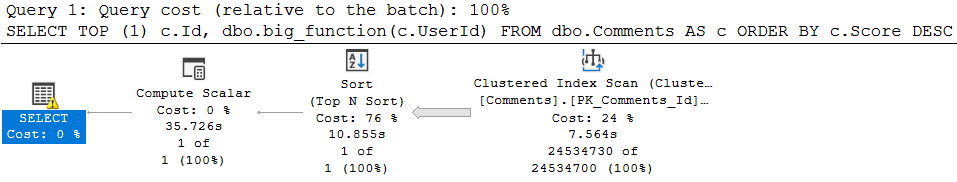
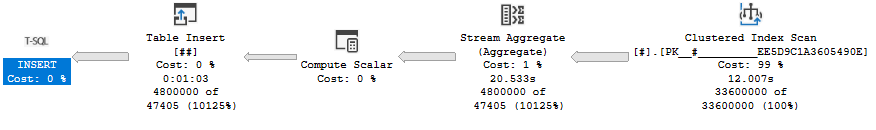
The above query takes about 63 seconds on my machine with a cost of 2320.57 optimizer units. The query optimizer decided that a serial plan was the best choice:

SQL Server Query Plan

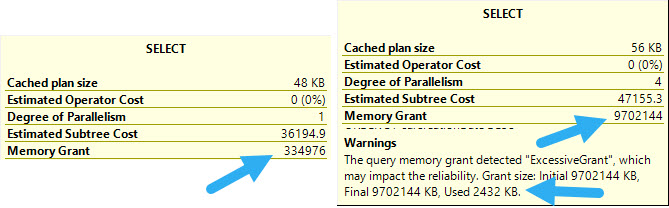
This is a rather lame result for a query tuning exercise so I will assume that I know better and force a parallel query plan with undocumented trace flag 8649. SQL Server warns us that the estimated cost is 4816.68 optimizer units but surely doesn’t expect a detail like that to stop me. The adjusted query executes in 75 seconds:

SQL Server Query Plan

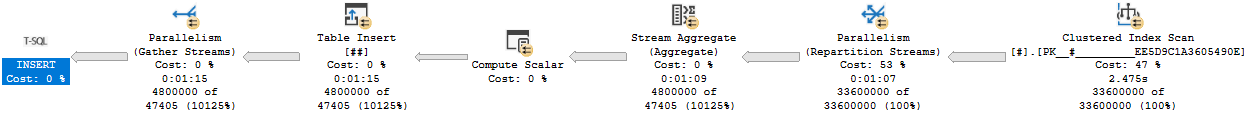
My arrogance is checked. The parallel query is slower than the serial version that the query optimizer wanted us to have. The problem is the hash exchange operator. It is an order preserving exchange with a high MAXDOP and wide rows. This is the worst possible situation for exchange performance. How else can we write the query? Batch mode is not available for STRING_AGG so that’s out. Does anyone remember anything about tuning row mode queries?

The Dark Side


Query hints along with carefully constructed T-SQL are the pathway to many abilities, some considered to be unnatural. We can give the classic Parallel Apply query pattern made famous by Adam Machanic a shot to solve this problem. Perhaps you are thinking that there is no driving table for the outer side of a nested loop join, but we can create one by sampling the clustered index of the base table. I’ll skip that part here and just use what I know about the data to divide it into 96 equal ranges:

DROP TABLE IF EXISTS ###;
CREATE TABLE ### (s BIGINT NOT NULL, e BIGINT NOT NULL);

INSERT INTO ###
VALUES
(1, 50000),
(50001, 100000),
(100001, 150000),
(150001, 200000),
(200001, 250000),
(250001, 300000),
(300001, 350000),
(350001, 400000),
(400001, 450000),
(450001, 500000),
(500001, 550000),
(550001, 600000),
(600001, 650000),
(650001, 700000),
(700001, 750000),
(750001, 800000),
(800001, 850000),
(850001, 900000),
(900001, 950000),
(950001, 1000000),
(1000001, 1050000),
(1050001, 1100000),
(1100001, 1150000),
(1150001, 1200000),
(1200001, 1250000),
(1250001, 1300000),
(1300001, 1350000),
(1350001, 1400000),
(1400001, 1450000),
(1450001, 1500000),
(1500001, 1550000),
(1550001, 1600000),
(1600001, 1650000),
(1650001, 1700000),
(1700001, 1750000),
(1750001, 1800000),
(1800001, 1850000),
(1850001, 1900000),
(1900001, 1950000),
(1950001, 2000000),
(2000001, 2050000),
(2050001, 2100000),
(2100001, 2150000),
(2150001, 2200000),
(2200001, 2250000),
(2250001, 2300000),
(2300001, 2350000),
(2350001, 2400000),
(2400001, 2450000),
(2450001, 2500000),
(2500001, 2550000),
(2550001, 2600000),
(2600001, 2650000),
(2650001, 2700000),
(2700001, 2750000),
(2750001, 2800000),
(2800001, 2850000),
(2850001, 2900000),
(2900001, 2950000),
(2950001, 3000000),
(3000001, 3050000),
(3050001, 3100000),
(3100001, 3150000),
(3150001, 3200000),
(3200001, 3250000),
(3250001, 3300000),
(3300001, 3350000),
(3350001, 3400000),
(3400001, 3450000),
(3450001, 3500000),
(3500001, 3550000),
(3550001, 3600000),
(3600001, 3650000),
(3650001, 3700000),
(3700001, 3750000),
(3750001, 3800000),
(3800001, 3850000),
(3850001, 3900000),
(3900001, 3950000),
(3950001, 4000000),
(4000001, 4050000),
(4050001, 4100000),
(4100001, 4150000),
(4150001, 4200000),
(4200001, 4250000),
(4250001, 4300000),
(4300001, 4350000),
(4350001, 4400000),
(4400001, 4450000),
(4450001, 4500000),
(4500001, 4550000),
(4550001, 4600000),
(4600001, 4650000),
(4650001, 4700000),
(4700001, 4750000),
(4750001, 4800000);

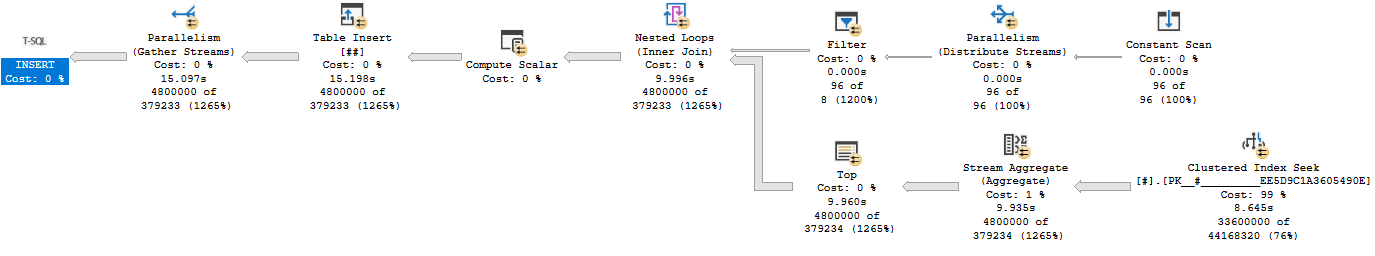
I can now construct a query that gets a parallel apply type of plan:

INSERT INTO ## WITH (TABLOCK)
SELECT ca.*
FROM ### driver
CROSS APPLY (
	SELECT TOP (987654321987654321) ID, CHECKSUM(STRING_AGG(STRING_TO_AGG , ',') WITHIN GROUP (ORDER BY ID2)) ALL_STRINGS_CHECKSUM
	FROM # WITH (FORCESEEK)
	WHERE ID BETWEEN driver.s AND driver.e
	GROUP BY ID
) ca
OPTION (MAXDOP 8, NO_PERFORMANCE_SPOOL, FORCE ORDER);

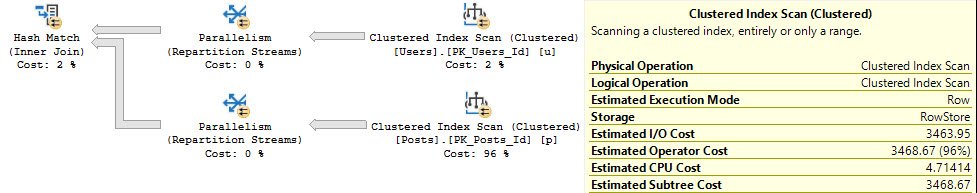
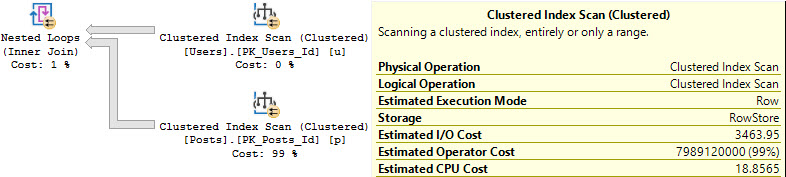
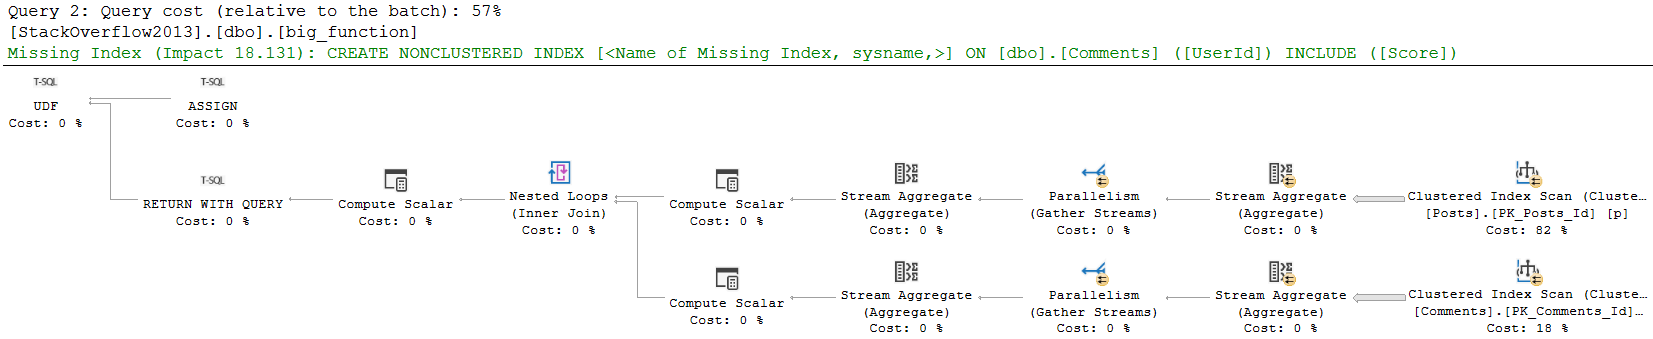
This is an unnatural query plan. The query optimizer assigned it a cost of 36248.7 units. I had to add the TOP to get a valid query plan with an index seek. Removing the TOP operator results in error 8622. Naturally such things won’t stop us and running the query results in an execution time between 15 – 19 seconds on my machine which is the best result yet.

SQL Server Query Plan

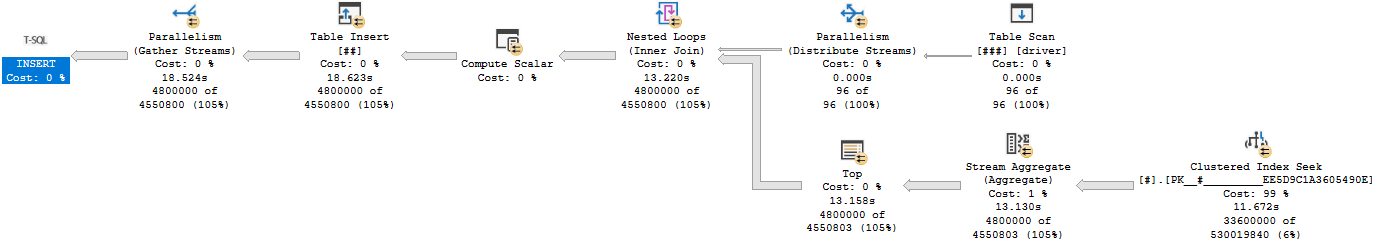
This query plan has an exchange partitioning type of round robin. Recall such exchange types can lead to trouble if there’s other work executing on one of the schedulers used by a parallel worker thread. So far I’ve been testing these MAXDOP 8 queries with nothing else running on my 8 core machine. I can make a scheduler busy by running a MAXDOP 1 query that has no real reason to yield before exhausting its 4 ms quantum. Here is one way to accomplish that:

SELECT TOP (1) t1.high + t2.high + t3.high + t4.high
FROM master..spt_values t1
CROSS JOIN master..spt_values t2
CROSS JOIN master..spt_values t3
CROSS JOIN master..spt_values t4
ORDER BY t1.high + t2.high + t3.high + t4.high
OPTION (MAXDOP 1, NO_PERFORMANCE_SPOOL);

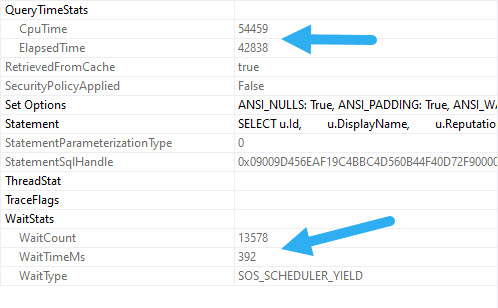
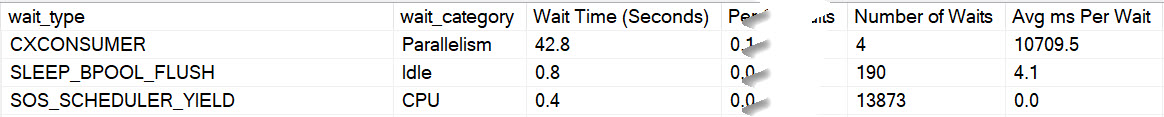
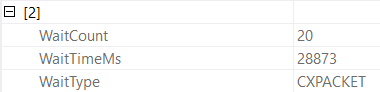
Wait stats for this query if you don’t believe me:

SQL Server Wait Stats

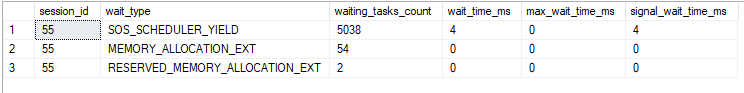
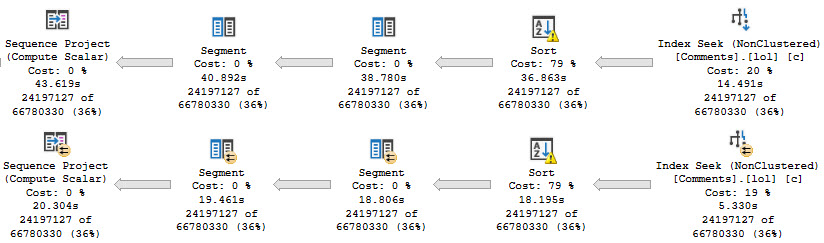
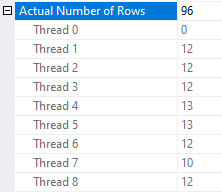
Running this query at the same time as the parallel query can apply a large performance penalty to the parallel query. The parallel query can take up to 48 seconds to execute if even a single worker thread has to share time on a scheduler with another. That is, the query ran 3 times slower when I added a single MAXDOP 1 query to the workload. Looking at thread details for the parallel query:

SQL Server Threads

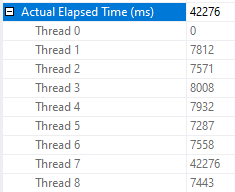
As you can see, one of the worker threads took a significantly longer amount of time to complete its work compared to the other threads. There is no logged wait statistic for this kind of performance problem in which the other parallel worker threads complete their work much earlier than when the query finishes. If there’s no worker thread then there is no wait associated with the query. The only way to catch this is to look at actual row distribution or the CPU time to elapsed time ratio.

You may be wondering why the query is worse than twice as slow as before. After all, if all workers do an equal amount of work but one now gets access to half as much CPU as before it seems reasonable to expect the runtime to double instead of triple. The workers of the parallel query have many reasons they might yield before exhausting their full 4 ms quantum – an I/O wait for example. The MAXDOP 1 SELECT query is designed to not yield early. What is very likely happening is that the MAXDOP 1 query gets a larger share of the scheduler’s resources than 50%. SQL Server 2016 made adjustments to try to limit this type of situation but by its very nature I don’t see how it could ever lead to a perfect sharing of a scheduler’s resources.

Demanding Demand Partitioning


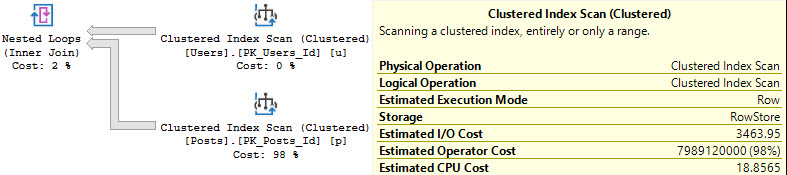
We can get an exchange operator with demand based partitioning by replacing the driving temp table with a derived table. Full query text below:

INSERT INTO ## WITH (TABLOCK)
SELECT ca.*
FROM (
VALUES
(1, 50000),
(50001, 100000),
(100001, 150000),
(150001, 200000),
(200001, 250000),
(250001, 300000),
(300001, 350000),
(350001, 400000),
(400001, 450000),
(450001, 500000),
(500001, 550000),
(550001, 600000),
(600001, 650000),
(650001, 700000),
(700001, 750000),
(750001, 800000),
(800001, 850000),
(850001, 900000),
(900001, 950000),
(950001, 1000000),
(1000001, 1050000),
(1050001, 1100000),
(1100001, 1150000),
(1150001, 1200000),
(1200001, 1250000),
(1250001, 1300000),
(1300001, 1350000),
(1350001, 1400000),
(1400001, 1450000),
(1450001, 1500000),
(1500001, 1550000),
(1550001, 1600000),
(1600001, 1650000),
(1650001, 1700000),
(1700001, 1750000),
(1750001, 1800000),
(1800001, 1850000),
(1850001, 1900000),
(1900001, 1950000),
(1950001, 2000000),
(2000001, 2050000),
(2050001, 2100000),
(2100001, 2150000),
(2150001, 2200000),
(2200001, 2250000),
(2250001, 2300000),
(2300001, 2350000),
(2350001, 2400000),
(2400001, 2450000),
(2450001, 2500000),
(2500001, 2550000),
(2550001, 2600000),
(2600001, 2650000),
(2650001, 2700000),
(2700001, 2750000),
(2750001, 2800000),
(2800001, 2850000),
(2850001, 2900000),
(2900001, 2950000),
(2950001, 3000000),
(3000001, 3050000),
(3050001, 3100000),
(3100001, 3150000),
(3150001, 3200000),
(3200001, 3250000),
(3250001, 3300000),
(3300001, 3350000),
(3350001, 3400000),
(3400001, 3450000),
(3450001, 3500000),
(3500001, 3550000),
(3550001, 3600000),
(3600001, 3650000),
(3650001, 3700000),
(3700001, 3750000),
(3750001, 3800000),
(3800001, 3850000),
(3850001, 3900000),
(3900001, 3950000),
(3950001, 4000000),
(4000001, 4050000),
(4050001, 4100000),
(4100001, 4150000),
(4150001, 4200000),
(4200001, 4250000),
(4250001, 4300000),
(4300001, 4350000),
(4350001, 4400000),
(4400001, 4450000),
(4450001, 4500000),
(4500001, 4550000),
(4550001, 4600000),
(4600001, 4650000),
(4650001, 4700000),
(4700001, 4750000),
(4750001, 4800000)
) driver( s, e)
CROSS APPLY (
	SELECT TOP (987654321987654321) ID, CHECKSUM(STRING_AGG(STRING_TO_AGG , ',') WITHIN GROUP (ORDER BY ID2)) ALL_STRINGS_CHECKSUM
	FROM # WITH (FORCESEEK)
	WHERE ID BETWEEN CAST(driver.s AS BIGINT) AND CAST(driver.e AS BIGINT)
	GROUP BY ID
) ca
OPTION (MAXDOP 8, NO_PERFORMANCE_SPOOL, FORCE ORDER);

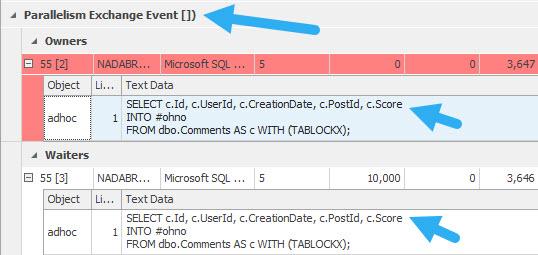
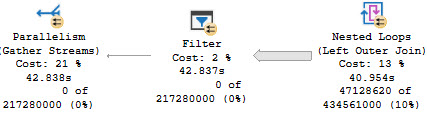
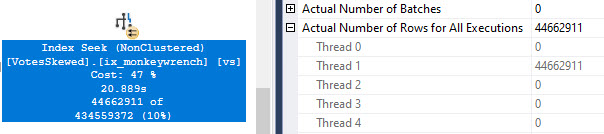
Query performance is effectively random. The query was observed to execute as quickly as 15 seconds and as slowly as 45 seconds. In some situations there was an incredible amount of skew in row distributions between threads:

SQL Server Threads

SQL Server Threads

SQL Server Threads

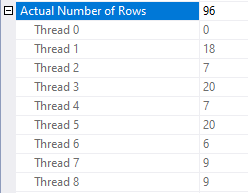
This is an unexpected situation if there are no other queries running on the server. Query performance is most disappointing.

Is there a trace flag?


Yes! The problem here is that the nested loop join uses the prefetch optimization. Paul White writes:

One of the available SQL Server optimizations is nested loops prefetching. The general idea is to issue asynchronous I/O for index pages that will be needed by the inner side — and not just for the current correlated join parameter value, but for future values too.

That sounds like it might be wildly incompatible with a demand exchange operator. Querying sys.dm_exec_query_profiles during query execution proves that the demand exchange isn’t working as expected: worker threads no longer fully process the results associated with their current row before requesting the next one. That is what can lead to wild skew between the worker threads and as a result query performance is effectively random.

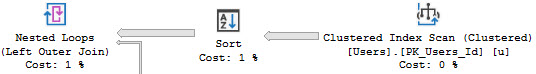
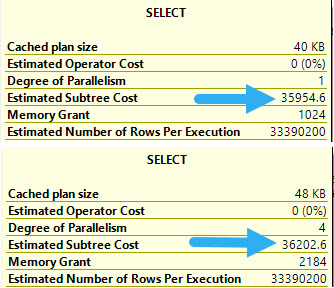
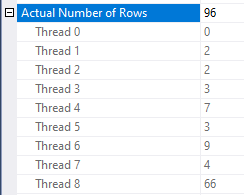
Documented trace flag 8744 disables this optimization. Adding it to the query using QUERYTRACEON results in much more stable performance. The query typically finishes in about 15 seconds. Here is an example thread distribution:

SQL Server Threads

If you fight the ISV fight like I do, you may not be able to enable trace flags for individual queries. If you’re desperate you could try artificially lowering the cardinality estimate from the derived table. An OPTIMIZE FOR query hint with a direct filter is my preferred way to accomplish this. I like to set the cardinality estimate equal to MAXDOP but I have no real basis for doing this. Here is the full query text:

DECLARE @filter BIGINT = 987654321987654321;
INSERT INTO ## WITH (TABLOCK)
SELECT ca.*
FROM (
VALUES
(1, 50000),
(50001, 100000),
(100001, 150000),
(150001, 200000),
(200001, 250000),
(250001, 300000),
(300001, 350000),
(350001, 400000),
(400001, 450000),
(450001, 500000),
(500001, 550000),
(550001, 600000),
(600001, 650000),
(650001, 700000),
(700001, 750000),
(750001, 800000),
(800001, 850000),
(850001, 900000),
(900001, 950000),
(950001, 1000000),
(1000001, 1050000),
(1050001, 1100000),
(1100001, 1150000),
(1150001, 1200000),
(1200001, 1250000),
(1250001, 1300000),
(1300001, 1350000),
(1350001, 1400000),
(1400001, 1450000),
(1450001, 1500000),
(1500001, 1550000),
(1550001, 1600000),
(1600001, 1650000),
(1650001, 1700000),
(1700001, 1750000),
(1750001, 1800000),
(1800001, 1850000),
(1850001, 1900000),
(1900001, 1950000),
(1950001, 2000000),
(2000001, 2050000),
(2050001, 2100000),
(2100001, 2150000),
(2150001, 2200000),
(2200001, 2250000),
(2250001, 2300000),
(2300001, 2350000),
(2350001, 2400000),
(2400001, 2450000),
(2450001, 2500000),
(2500001, 2550000),
(2550001, 2600000),
(2600001, 2650000),
(2650001, 2700000),
(2700001, 2750000),
(2750001, 2800000),
(2800001, 2850000),
(2850001, 2900000),
(2900001, 2950000),
(2950001, 3000000),
(3000001, 3050000),
(3050001, 3100000),
(3100001, 3150000),
(3150001, 3200000),
(3200001, 3250000),
(3250001, 3300000),
(3300001, 3350000),
(3350001, 3400000),
(3400001, 3450000),
(3450001, 3500000),
(3500001, 3550000),
(3550001, 3600000),
(3600001, 3650000),
(3650001, 3700000),
(3700001, 3750000),
(3750001, 3800000),
(3800001, 3850000),
(3850001, 3900000),
(3900001, 3950000),
(3950001, 4000000),
(4000001, 4050000),
(4050001, 4100000),
(4100001, 4150000),
(4150001, 4200000),
(4200001, 4250000),
(4250001, 4300000),
(4300001, 4350000),
(4350001, 4400000),
(4400001, 4450000),
(4450001, 4500000),
(4500001, 4550000),
(4550001, 4600000),
(4600001, 4650000),
(4650001, 4700000),
(4700001, 4750000),
(4750001, 4800000)
) driver( s, e)
CROSS APPLY (
	SELECT TOP (987654321987654321) ID, CHECKSUM(STRING_AGG(STRING_TO_AGG , ',') WITHIN GROUP (ORDER BY ID2)) ALL_STRINGS_CHECKSUM
	FROM # WITH (FORCESEEK)
	WHERE ID BETWEEN CAST(driver.s AS BIGINT) AND CAST(driver.e AS BIGINT)
	GROUP BY ID
) ca
WHERE driver.s <= @filter
OPTION (OPTIMIZE FOR (@filter = 350001), MAXDOP 8, NO_PERFORMANCE_SPOOL, FORCE ORDER);

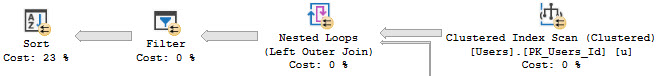
Query performance is the same as with TF 8744:

SQL Server Query Plan


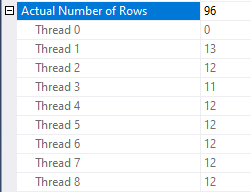
Does this query do better than round robin partitioning when there is a busy MAXDOP 1 query running at the same time? I ran it a few times and it completed in about 15-16 seconds every time. One of the worker threads does less work and the others cover for it:

SQL Server Threads

In this example the nested loop join only gets the prefetch optimization if the cardinality estimate is more than 25 rows. I do not know if that number is a fixed part of the algorithm for prefetch eligibility but it certainly feels unwise to rely on this behavior never changing in a future version of SQL Server. Note that prefetching is a trade-off. For some workloads you may be better off with round robin partitioning and prefetching compared to demand without prefetching. It’s hard to imagine a workload that would benefit from demand with prefetching but perhaps I’m not being creative enough in my thinking.

Final Thoughts


In summary, the example parallel apply query that uses demand partitioning performs 2-3 times better the query that uses round robin partitioning when another serial query is running on the server. The nested loop prefetch optimization does not work well witth exchange operator demand partitioning and should be avoided via a trace flag or other tricks if demand partitioning is in use.

There are a few things that Microsoft could do to improve the situation. A USE HINT that disables nested loop prefetching would be most welcome. I think that there’s also a fairly strong argument to make that a query pattern of a nested loop join with prefetching with a first child of a demand exchange operator is a bad pattern that the query optimizer should avoid if possible. Finally, it would be nice if there was a type of wait statistic triggered when some of a parallel query’s workers finish their work earlier than others. The problematic queries here have very little CXPACKET waits and no EXECSYNC waits. Imagine that I put a link to UserVoice requests here and imagine yourself voting for them.

Thanks for reading!

Going Further


If this is the kind of SQL Server stuff you love learning about, you’ll love my training. I’m offering a 75% discount to my blog readers if you click from here. I’m also available for consulting if you just don’t have time for that and need to solve performance problems quickly.

Detecting Parallel Query Plan Performance Issues In Query Store

Let’s Have Fun


I got asked recently if there’s a way to find parallel queries that are potentially skewed.

One thing that you’ll see quite often is that duration and cpu time aren’t much different. For parallel queries, it should be the opposite — you should be using more CPU in order to reduce duration. Granted, this query could also find queries that were blocked, but it’s a start.

WITH XMLNAMESPACES ( 'http://schemas.microsoft.com/sqlserver/2004/07/showplan' AS x ), 
skew AS 
(
    SELECT qsp.query_id, 
           qsp.plan_id,
           qsrs.avg_cpu_time / 1000. AS avg_cpu_time_ms, 
           qsrs.avg_duration / 1000. AS avg_duration_ms,
           (qsrs.avg_duration - qsrs.avg_cpu_time) / 1000. AS the_difference_ms,
           qsrs.avg_dop, 
           CONVERT(XML, qsp.query_plan) AS query_plan
    FROM sys.query_store_runtime_stats AS qsrs
    JOIN sys.query_store_plan AS qsp
        ON qsrs.plan_id = qsp.plan_id
    WHERE qsp.is_parallel_plan = 1
    AND qsrs.avg_duration >= qsrs.avg_cpu_time
)
SELECT sk.*
FROM skew AS sk
    OUTER APPLY sk.query_plan.nodes('//x:StmtSimple') AS s(c)
WHERE s.c.exist('@StatementType[.= "SELECT"]') = 1
ORDER BY sk.avg_duration_ms DESC;

If you’re wondering why I’m looking at the XML outside a CTE, it’s because Query Store doesn’t store plans in XML, so you get an error. This was the first workaround I found.

Msg 9506, Level 16, State 1, Line 125
The XMLDT method 'nodes' can only be invoked on columns of type xml.

And if you’re wondering how Query Store stores query plans, JOIN THE CLUB:

i quit.

Just when you thought the image datatype was deprecated, huh?

Thanks for reading!

Going Further


If this is the kind of SQL Server stuff you love learning about, you’ll love my training. I’m offering a 75% discount to my blog readers if you click from here. I’m also available for consulting if you just don’t have time for that and need to solve performance problems quickly.