Table Partitioning And Parallelism In SQL Server Standard Edition

Jammed, Not Jellied


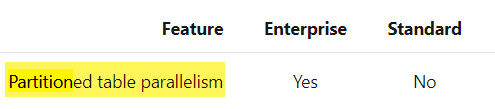
UPDATE 2021-04-14: Microsoft has updated the documentation for all 2016+ versions of SQL Server to indicate that parallelism is available for partitioned tables in non-Enterprise versions.

There’s been a note in the documentation since SQL Server 2016 SP1 brought certain Programmability Features™ to Standard Edition with regard to parallelism differences between Standard and Enterprise Edition.

howdy

For the sake of completeness, I did all my testing across both Standard and Developer Editions of SQL Server and couldn’t detect a meaningful difference.

Additionally, documentation about Parallel Query Execution Strategy for Partitioned Objects doesn’t note any differences in strategy between the two Editions.

There may be scenarios outside of the ones I tested that do show a difference, but, uh. I didn’t test those.

Obviously.

Every table is going to test this query at different DOPs.

SELECT
    DATEPART(YEAR, vp.CreationDate) AS VoteYear,
    DATEPART(MONTH, vp.CreationDate) AS VoteMonth,
    COUNT_BIG(DISTINCT vp.PostId) AS UniquePostVotes,
    SUM(vp.BountyAmount) AS TotalBounties
FROM dbo.Votes_p AS vp
GROUP BY
    DATEPART(YEAR, vp.CreationDate),
    DATEPART(MONTH, vp.CreationDate);

Two Partitions


Here’s the setup:

CREATE PARTITION FUNCTION VoteYear2013_pf(DATETIME)
    AS RANGE RIGHT FOR VALUES
    (
        '20130101'
    );
GO


CREATE PARTITION SCHEME VoteYear2013_ps
    AS PARTITION VoteYear2013_pf
    ALL TO ([PRIMARY]);

DROP TABLE IF EXISTS dbo.Votes2013_p;

CREATE TABLE dbo.Votes2013_p
(
    Id int NOT NULL,
    PostId int NOT NULL,
    UserId int NULL,
    BountyAmount int NULL,
    VoteTypeId int NOT NULL,
    CreationDate datetime NOT NULL,
    CONSTRAINT PK_Votes2013_p_Id
        PRIMARY KEY CLUSTERED (CreationDate, Id)
) ON VoteYear2013_ps(CreationDate);


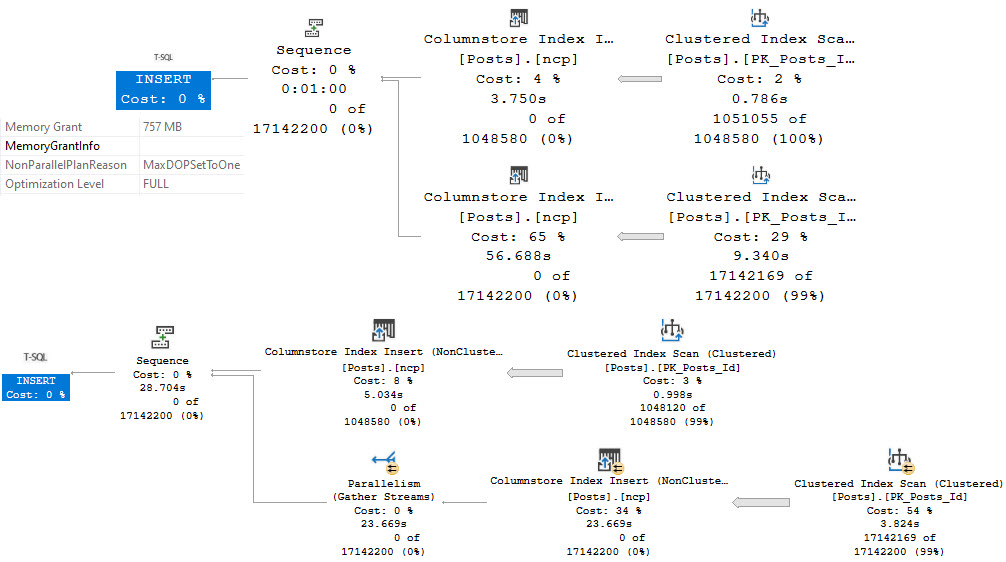
INSERT dbo.Votes2013_p WITH(TABLOCK)
    (Id, PostId, UserId, BountyAmount, VoteTypeId, CreationDate)
SELECT v.Id,
       v.PostId,
       v.UserId,
       v.BountyAmount,
       v.VoteTypeId,
       v.CreationDate
FROM dbo.Votes AS v;

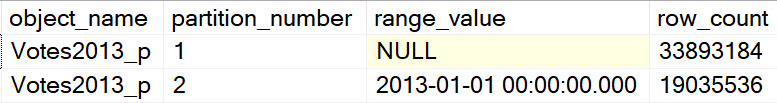
The data split looks like this:

SQL Server Query Results
not a good use of partitioning

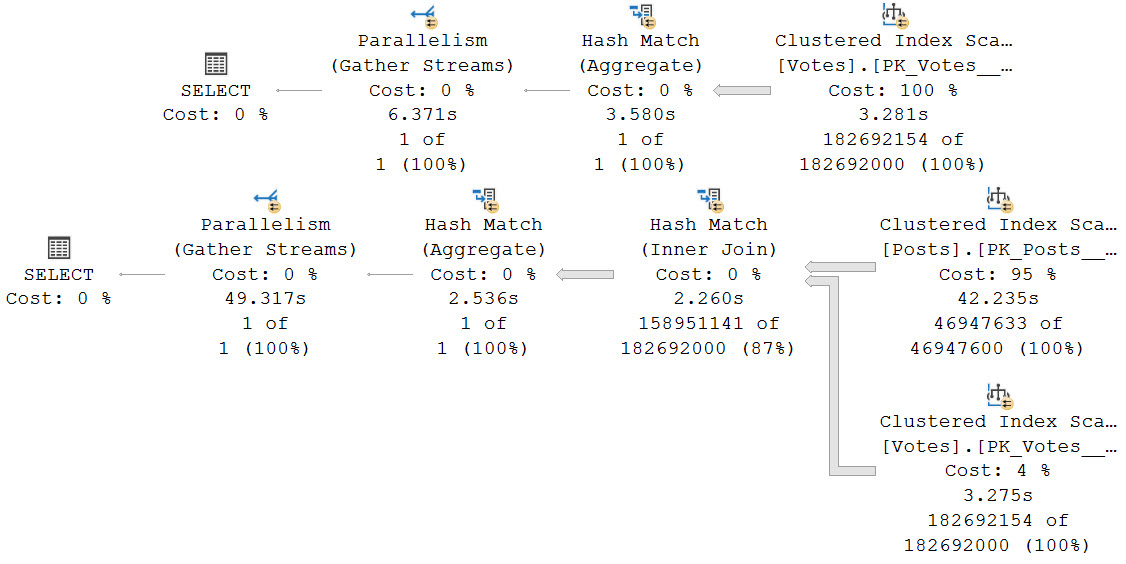
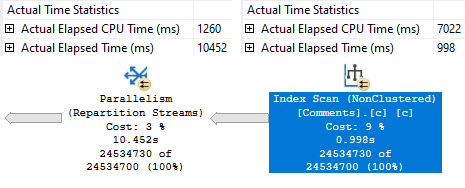
Running our test query at DOP 4, there are slight differences in counts across threads, but slight timing differences can explain that.

SQL Server Query Plan
bonker

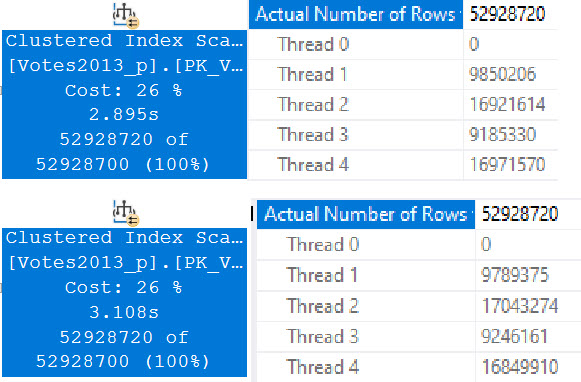
Standard Edition is on top, Developer Edition is at the bottom. There is a ~200ms difference here, but averaged out over multiple runs things end up pretty dead even.

Even looking at the row counts per thread, the distribution is close across both versions. I think it’s decently clear that the four threads work cooperatively across both partitions. A similar pattern continues at higher DOPs, too. I tested 8 and 16, and while there were slight differences in row counts per thread, there was a similar distribution pattern as at DOP 4.

Eight Partitions


Using a different partitioning function:

CREATE PARTITION FUNCTION VoteYear_pf(DATETIME)
    AS RANGE RIGHT FOR VALUES
    (
        '20080101',
        '20090101',
        '20100101',
        '20110101',
        '20120101',
        '20130101',
        '20140101'
    );
GO

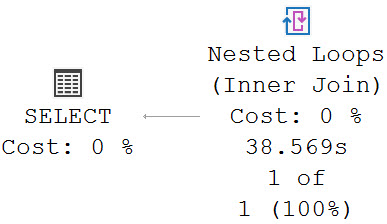
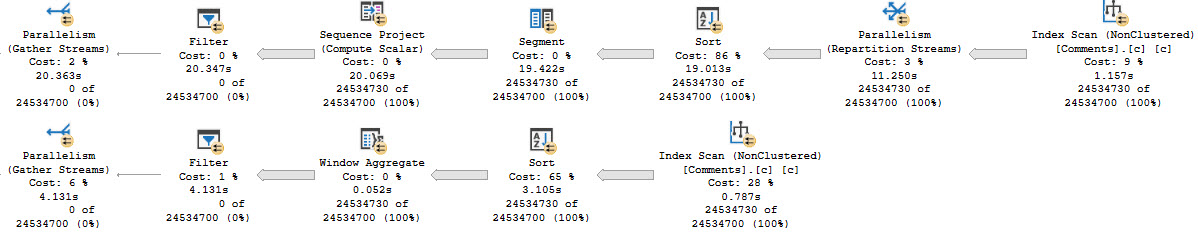
We’re going to jump right to testing the query at DOP 8.

SQL Server Query Plan
dartford

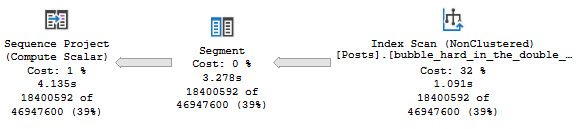
Again, different threads end up getting assigned the work, but row counts match exactly across threads that did get work, and those numbers line up exactly to the number of rows in each partition.

SQL Server Query Results
pattern forming

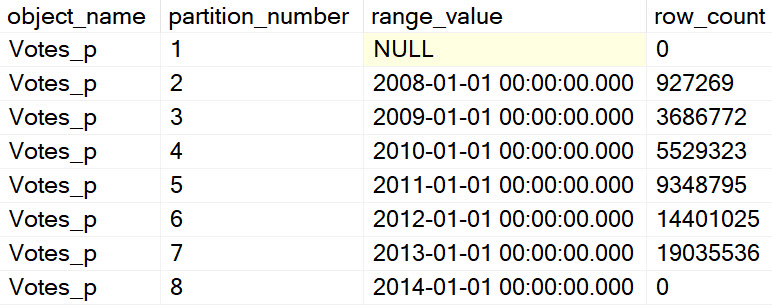
In both queries, two threads scanned a partition with no rows and did no work. Each thread that did scan a partition scanned only one partition.

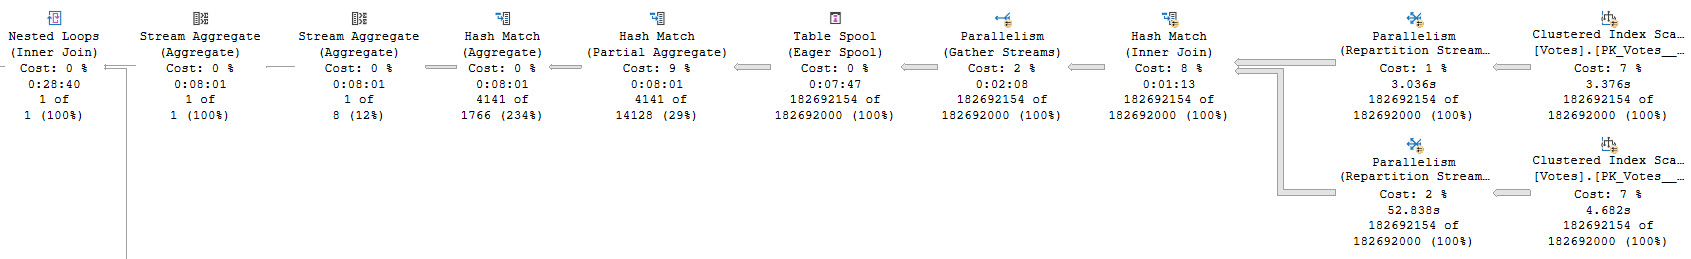
At DOP 16, the skew gets a bit worse, because now four threads do no work.

SQL Server Query Plan
crap

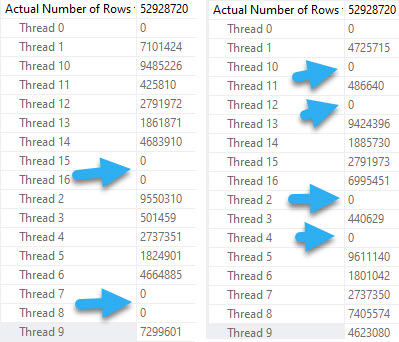
The remaining threads all seem to split the populated partitions evenly, though again there are slight timing differences that result in different row counts per thread, but it’s pretty clear that there is cooperation here.

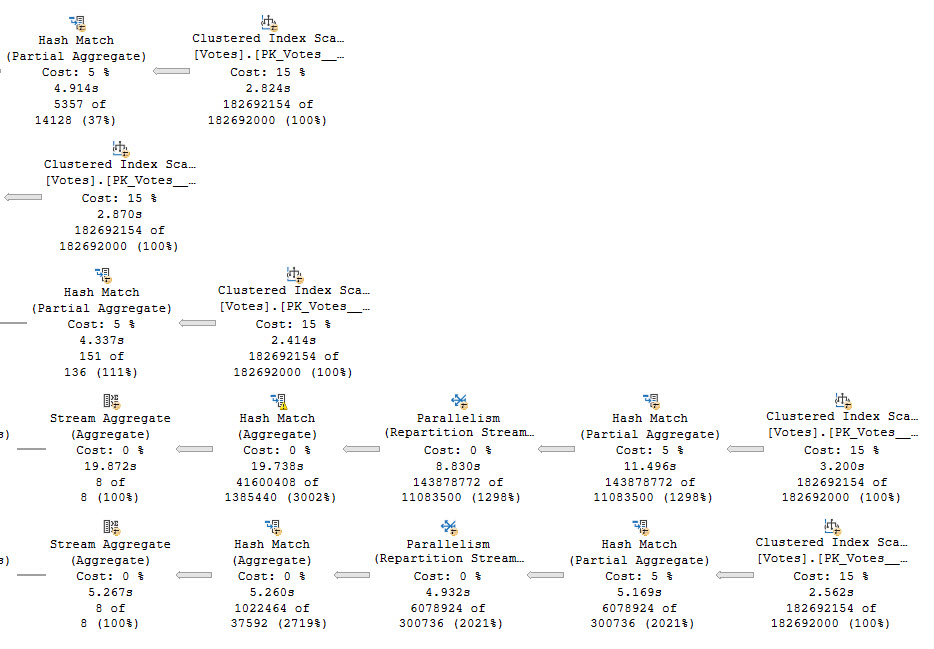
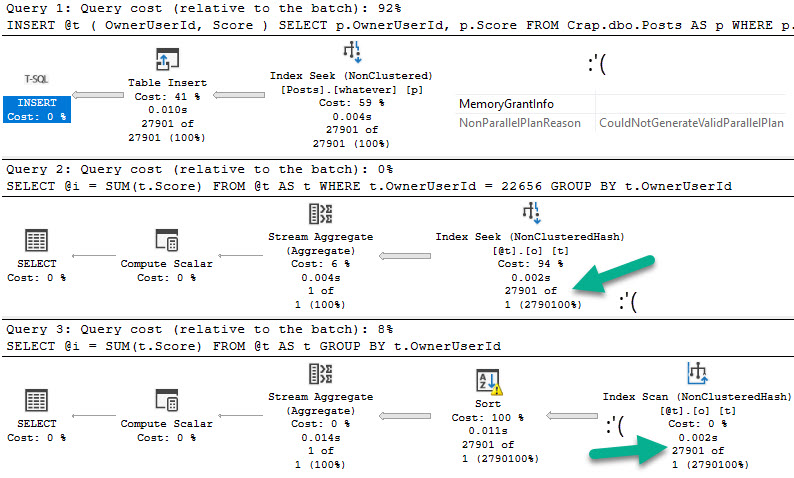
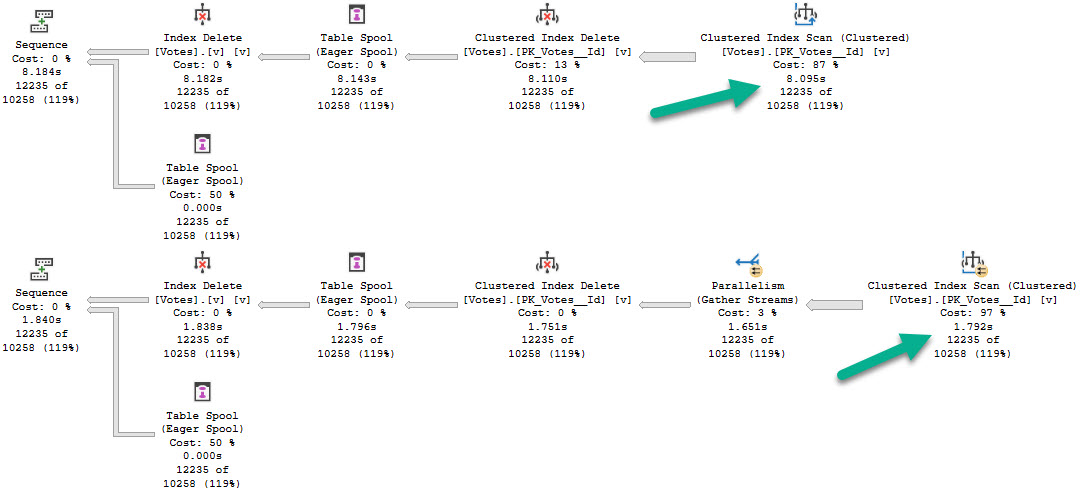
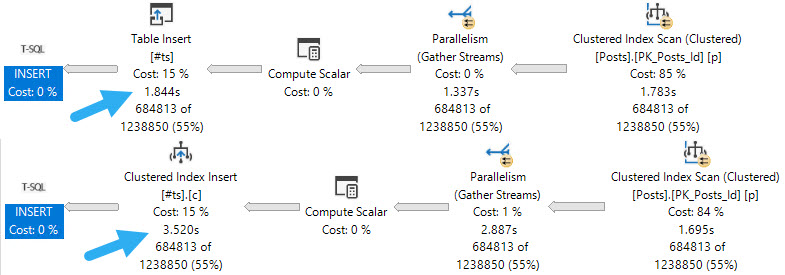
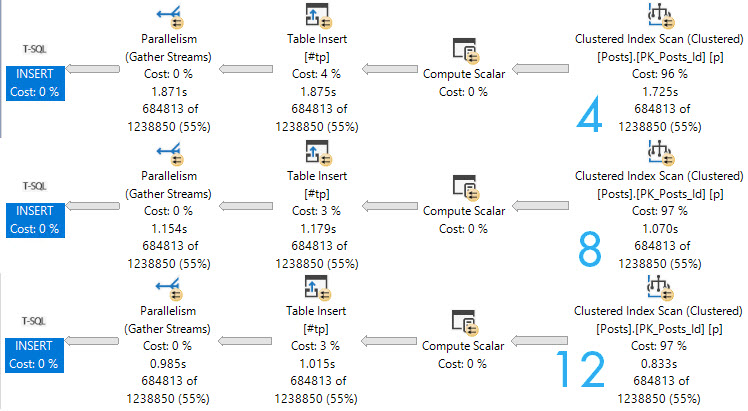
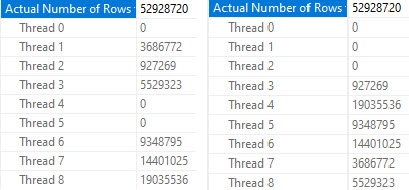
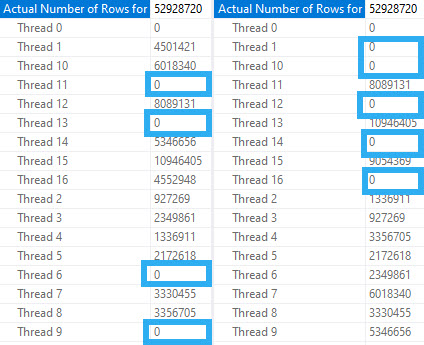
At DOP 4, things get a bit more interesting.

SQL Server Query Plan
bedhead

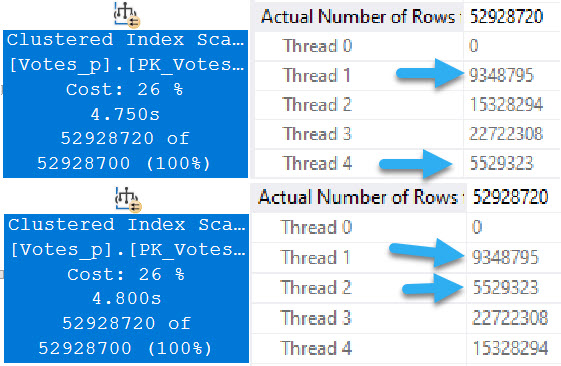
In both queries, two threads scan exactly one partition.

The rows with arrows pointing at them represent numbers that exactly match the number of rows in a single partition.

The remaining threads have exactly the same row counts across versions.
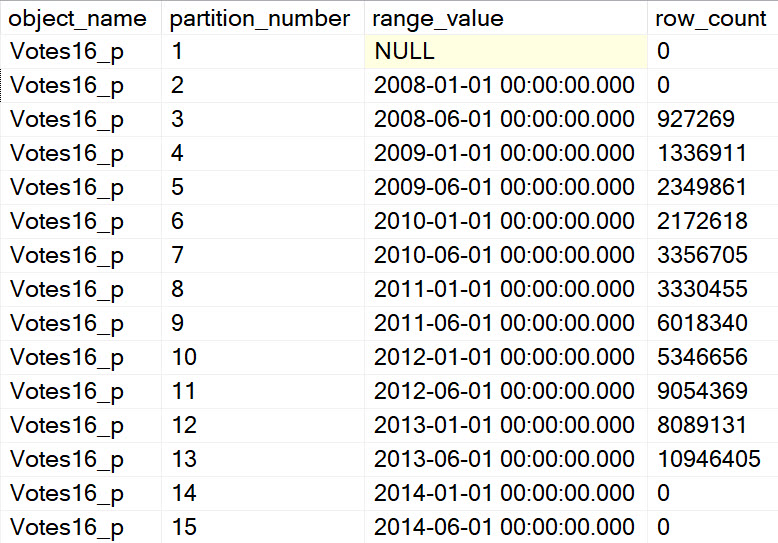
Fifteen Partitions


The results here show mostly the same pattern as before, so I’m keeping it short.

CREATE PARTITION FUNCTION VoteYear16_pf(DATETIME)
    AS RANGE RIGHT FOR VALUES
    (
        '20080101',
        '20080601',
        '20090101',
        '20090601',	    
        '20100101',
        '20100601',
        '20110101',
        '20110601',
        '20120101',
        '20120601',
        '20130101',
        '20130601',
        '20140101',
        '20140601'
    );
GO

At DOP 4 and 8, threads work cooperatively across partitions. Where things get interesting (sort of) is at DOP 16.

SQL Server Query Results
craptastic

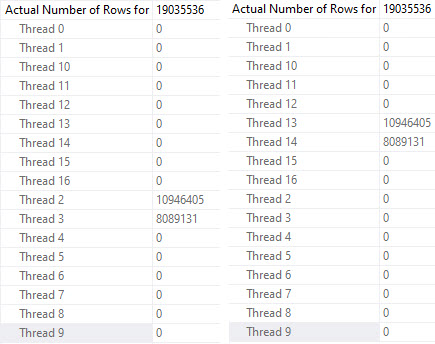
The four empty partitions here result in 4 threads doing no work in Developer/Enterprise Edition, and 5 threads doing no work in Standard Edition.

SQL Server Query Plan
donkey

At first, I thought this might be a crack in the case, so I did things a little bit differently. In a dozen or so runs, the 5 empty threads only seemed to occur in the Standard Edition query. Sometimes it did, sometimes it didn’t. But it was at least something.

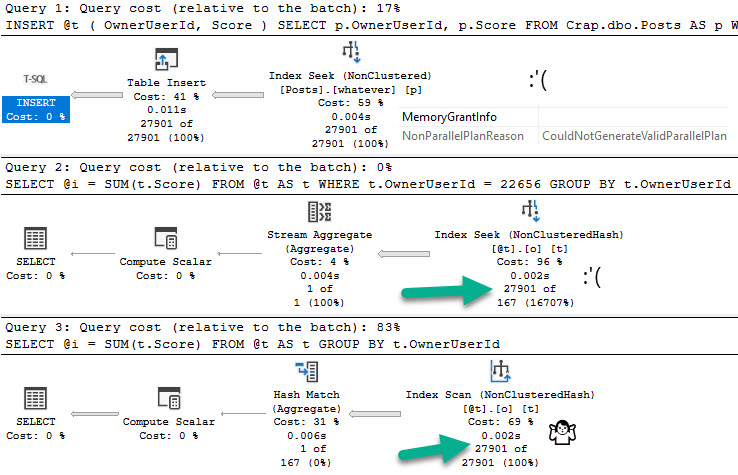
Fifteen Partitions, Mostly Empty


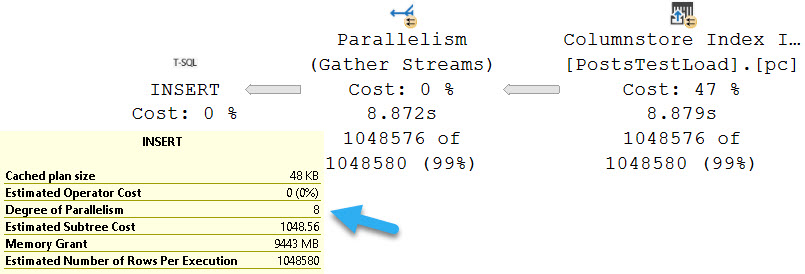
I used the same setup as above, but this time I didn’t fully load data from Votes in:

INSERT dbo.Votes16e_p WITH(TABLOCK)
    (Id, PostId, UserId, BountyAmount, VoteTypeId, CreationDate)
SELECT v.Id,
       v.PostId,
       v.UserId,
       v.BountyAmount,
       v.VoteTypeId,
       v.CreationDate
FROM dbo.Votes AS v
WHERE v.CreationDate >= '20130101';

And… Scene!

SQL Server Query Plan
flop

That’s Just Great


Aside from one case where an extra thread got zero rows in Standard Edition, the behavior across the board looks the same.

Most of the behavior is sensible, but cases where multiple threads get no rows and don’t move on to other partitions is a little troubling.

Not that anyone has partitioning set up right anyway.

Thanks for reading!

Going Further


If this is the kind of SQL Server stuff you love learning about, you’ll love my training. I’m offering a 75% discount to my blog readers if you click from here. I’m also available for consulting if you just don’t have time for that and need to solve performance problems quickly.

How Useful Is Column Store Indexing In SQL Server Standard Edition?

Speed Limit


When I’m blogging about performance tuning, most of it is from the perspective of Enterprise Edition. That’s where you need to be if you’re serious about getting SQL Server to go as fast as possible. Between the unrealistic memory limits and other feature restrictions, Standard Edition just doesn’t hold up.

Sure, you can probably get by with it for a while, but once performance becomes a primary concern it’s time to fork over an additional 5k a core for the big boat.

They don’t call it Standard Edition because it’s The Standard, like the hotel. Standard is a funny word like that. It can denote either high or low standing through clever placement of “the”.  Let’s try an experiment:

  • Erik’s blogging is standard for technical writing
  • Erik’s blogging is the standard for technical writing

Now you see where you stand with standard edition. Not with “the”, that’s for sure. “The” has left the building.

Nerd Juice


A lot of the restrictions for column store in Standard Edition are documented, but:

  • DOP limit of two for queries
  • No parallelism for creating or rebuilding indexes
  • No aggregate pushdown
  • No string predicate pushdown
  • No SIMD support

Here’s a comparison for creating a nonclustered column store index in Standard and Enterprise/Developer Editions:

SQL Server Query Plan
your fly is down

The top plan is from Standard Edition, and runs for a minute in a full serial plan. There is a non-parallel plan reason in the operator properties: MaxDOPSetToOne.

I do not have DOP set to one anywhere, that’s just the restriction kicking in. You can try it out for yourself if you have Standard Edition sitting around somewhere. I’m doing all my testing on SQL Server 2019 CU9. This is not ancient technology at the time of writing.

The bottom plan is from Enterprise/Developer Edition, where the the plan is able to run partially in parallel, and takes 28 seconds (about half the time as the serial plan).

Query Matters


One of my favorite query tuning tricks is getting batch mode to happen on queries that process a lot of rows. It doesn’t always help, but it’s almost always worth trying.

The problem is that on Standard Edition, if you’re processing a lot of rows, being limited to a DOP of 2 can be a real hobbler. In many practical cases, a batch mode query at DOP 2 will end up around the same as a row mode query at DOP 8. It’s pretty unfortunate.

In some cases, it can end up being much worse.

SELECT 
    MIN(p.Id) AS TinyId,
    COUNT_BIG(*) AS records
FROM dbo.Posts AS p WITH(INDEX = ncp)
JOIN dbo.Votes AS v
    ON p.Id = v.PostId
WHERE p. OwnerUserId = 22656;

SELECT 
    MIN(p.Id) AS TinyId,
    COUNT_BIG(*) AS records
FROM dbo.Posts AS p WITH(INDEX = 1)
JOIN dbo.Votes AS v
    ON p.Id = v.PostId
WHERE p. OwnerUserId = 22656;

Here’s the query plan for the first one, which uses the nonclustered column store index on Posts. There is no hint or setting that’s keeping DOP at 2, this really is just a feature restriction.

SQL Server Query Plan
drop it like it’s dop

Higher Ground


The second query, which is limited by the MAXDOP setting to 8, turns out much faster. The batch mode query takes 3.8 seconds, and the row mode query takes 1.4 seconds.

SQL Server Query Plan
it’s a new craze

In Enterprise Edition, there are other considerations for getting batch mode going, like memory grant feedback or adaptive joins, but those aren’t available in Standard Edition.

In a word, that sucks.

Dumb Limit


The restrictions on creating and rebuilding column store indexes to DOP 1 (both clustered and nonclustered), and queries to DOP 2 all seems even more odd when we consider that there is no restriction on inserting data into a table with a column store index on it.

As an example:

SELECT 
    p.*
INTO dbo.PostsTestLoad
FROM dbo.Posts AS p
WHERE 1 = 0;

CREATE CLUSTERED COLUMNSTORE INDEX pc ON dbo.PostsTestLoad;

SET IDENTITY_INSERT dbo.PostsTestLoad ON;

INSERT dbo.PostsTestLoad WITH(TABLOCK)
(
    Id, AcceptedAnswerId, AnswerCount, Body, ClosedDate, 
    CommentCount, CommunityOwnedDate, CreationDate, 
    FavoriteCount, LastActivityDate, LastEditDate, 
    LastEditorDisplayName, LastEditorUserId, OwnerUserId, 
    ParentId, PostTypeId, Score, Tags, Title, ViewCount 
)
SELECT TOP (1024 * 1024)
    p.Id, p.AcceptedAnswerId, p.AnswerCount, p.Body, p.ClosedDate, p.
    CommentCount, p.CommunityOwnedDate, p.CreationDate, p.
    FavoriteCount, p.LastActivityDate, p.LastEditDate, p.
    LastEditorDisplayName, p.LastEditorUserId, p.OwnerUserId, p.
    ParentId, p.PostTypeId, p.Score, p.Tags, p.Title, p.ViewCount 
FROM dbo.Posts AS p;

SET IDENTITY_INSERT dbo.PostsTestLoad OFF;
SQL Server Query Plan
smells like dop spirit

Unsupportive Parents


These limits are asinine, plain and simple, and I hope at some point they’re reconsidered. While I don’t expect everything from Standard Edition, because it is Basic Cable Edition, I do think that some of the restrictions go way too far.

Perhaps an edition somewhere between Standard and Enterprise would make sense. When you line the two up, the available features and pricing are incredibly stark choices.

There are often mixed needs as well, where some people need Standard Edition with fewer HA restrictions, and some people need it with fewer performance restrictions.

Thanks for reading!

Going Further


If this is the kind of SQL Server stuff you love learning about, you’ll love my training. I’m offering a 75% discount to my blog readers if you click from here. I’m also available for consulting if you just don’t have time for that and need to solve performance problems quickly.

Multiple Distinct Aggregates: Still Harm Performance Without Batch Mode In SQL Server

Growler


Well over 500 years ago, Paul White wrote an article about distinct aggregates. Considering how often I see it while working with clients, and that Microsoft created column store indexes and batch mode rather than allow for hash join hints on CLR UDFs, the topic feels largely ignored.

But speaking of all that stuff, let’s look at how Batch Mode fixes multiple distinct aggregates.

Jumbo Size


A first consideration is around parallelism, since you don’t pay attention or click links, here’s a quote you won’t read from Paul’s article above:

Another limitation is that this spool does not support parallel scan for reading, so the optimizer is very unlikely to restart parallelism after the spool (or any of its replay streams).

In queries that operate on large data sets, the parallelism implications of the spool plan can be the most important cause of poor performance.

What does that mean for us? Let’s go look. For this demo, I’m using SQL Server 2019 with the compatibility level set to 140.

SELECT
   COUNT_BIG(DISTINCT v.PostId) AS PostId,
   COUNT_BIG(DISTINCT v.UserId) AS UserId,
   COUNT_BIG(DISTINCT v.BountyAmount) AS BountyAmount,
   COUNT_BIG(DISTINCT v.VoteTypeId) AS VoteTypeId,
   COUNT_BIG(DISTINCT v.CreationDate) AS CreationDate
FROM dbo.Votes AS v;

In the plan for this query, we scan the clustered index of the Votes table five times, or once per distinct aggregate.

SQL Server Query Plan
skim scan

In case you’re wondering, this results in one intent shared object lock on the Votes table.

<Object name="Votes" schema_name="dbo">
  <Locks>
    <Lock resource_type="OBJECT" request_mode="IS" request_status="GRANT" request_count="9" />
    <Lock resource_type="PAGE" page_type="*" index_name="PK_Votes__Id" request_mode="S" request_status="GRANT" request_count="14" />
  </Locks>
</Object>

This query runs for 38.5 seconds, as the crow flies.

SQL Server Query Plan
push the thing

A Join Appears


Let’s join Votes to Posts for no apparent reason.

SELECT
   COUNT_BIG(DISTINCT v.PostId) AS PostId,
   COUNT_BIG(DISTINCT v.UserId) AS UserId,
   COUNT_BIG(DISTINCT v.BountyAmount) AS BountyAmount,
   COUNT_BIG(DISTINCT v.VoteTypeId) AS VoteTypeId,
   COUNT_BIG(DISTINCT v.CreationDate) AS CreationDate
FROM dbo.Votes AS v
JOIN dbo.Posts AS p
    ON p.Id = v.PostId;

The query plan now has two very distinct (ho ho ho) parts.

SQL Server Query Plan
problemium

This is part 1. Part 1 is a spoiler. Ignoring that Repartition Streams is bizarre and Spools are indefensible blights, as we meander across the execution plan we find ourselves at a stream aggregate whose child operators have executed for 8 minutes, and then a nested loops join whose child operators have run for 20 minutes and 39 seconds. Let’s go look at that part of the plan.

SQL Server Query Plan
downstream

Each branch here represents reading from the same spool. We can tell this because the Spool operators do not have any child operators. They are starting points for the flow of data. One thing to note here is that there are four spools instead of five, and that’s because one of the five aggregates was processed in the first part of the query plan we looked at.

The highlighted branch is the one that accounts for the majority of the execution time, at 19 minutes, 8 seconds. This branch is responsible for aggregating the PostId column. Apparently a lack of distinct values is hard to process.

But why is this so much slower? The answer is parallelism, or a lack thereof. So, serialism. Remember the 500 year old quote from above?

Another limitation is that this spool does not support parallel scan for reading, so the optimizer is very unlikely to restart parallelism after the spool (or any of its replay streams).

In queries that operate on large data sets, the parallelism implications of the spool plan can be the most important cause of poor performance.

Processing that many rows on a single thread is painful across all of the operators.

Flounder Edition


With SQL Server 2019, we get Batch Mode On Row store when compatibility level gets bumped up to 150.

The result is just swell.


SQL Server Query Plan
yes you can

The second query with the join still runs for nearly a minute, but 42 seconds of the process is scanning that big ol’ Posts table.

Grumpy face.

Thanks for reading!

Going Further


If this is the kind of SQL Server stuff you love learning about, you’ll love my training. I’m offering a 75% discount to my blog readers if you click from here. I’m also available for consulting if you just don’t have time for that and need to solve performance problems quickly.

What’s Really Different About In-Memory Table Variables In SQL Server?

Kendra, Kendra, Kendra


My dear friend Kendra asked… Okay, look, I might have dreamed this. But I maybe dreamed that she asked what people’s Cost Threshold For Blogging™ is. Meaning, how many times do you have to get asked a question before you write about it.

I have now heard people talking and asking about in-memory table variables half a dozen times, so I guess here we are.

Talking about table variables.

In memory.

Yes, Have Some


First, yes, they do help relieve tempdb contention if you have code that executes under both high concurrency and frequency. And by high, I mean REALLY HIGH.

Like, Snoop Dogg high.

Because you can’t get rid of in memory stuff, I’m creating a separate database to test in.

Here’s how I’m doing it!

CREATE DATABASE trash;

ALTER DATABASE trash 
ADD FILEGROUP trashy 
    CONTAINS MEMORY_OPTIMIZED_DATA ;
     
ALTER DATABASE trash 
ADD FILE 
(
    NAME=trashcan, 
    FILENAME='D:\SQL2019\maggots'
) 
TO FILEGROUP trashy;

USE trash;

CREATE TYPE PostThing 
AS TABLE
(
    OwnerUserId int,
    Score int,
    INDEX o HASH(OwnerUserId)
    WITH(BUCKET_COUNT = 100)
) WITH
(
    MEMORY_OPTIMIZED = ON
);
GO

Here’s how I’m testing things:

CREATE OR ALTER PROCEDURE dbo.TableVariableTest(@Id INT)
AS
BEGIN

    SET NOCOUNT, XACT_ABORT ON;
    
    DECLARE @t AS PostThing;
    DECLARE @i INT;

    INSERT @t 
        ( OwnerUserId, Score )
    SELECT 
        p.OwnerUserId,
        p.Score
    FROM Crap.dbo.Posts AS p
    WHERE p.OwnerUserId = @Id;

    SELECT 
        @i = SUM(t.Score)
    FROM @t AS t
    WHERE t.OwnerUserId = 22656
    GROUP BY t.OwnerUserId;

    SELECT 
        @i = SUM(t.Score)
    FROM @t AS t
    GROUP BY t.OwnerUserId;

END;
GO

Hot Suet


So like, the first thing I did was use SQL Query Stress to run this on a bunch of threads, and I didn’t see any tempdb contention.

So that’s cool. But now you have a bunch of stuff taking up space in memory. Precious memory. Do you have enough memory for all this?

Marinate on that.

Well, okay. Surely they must improve on all of the issues with table variables in some other way:

  • Modifications can’t go parallel
  • Bad estimates
  • No column level stats

But, nope. No they don’t. It’s the same crap.

Minus the tempdb contetion.

Plus taking up space in memory.

But 2019


SQL Server 2019 does offer the same table level cardinality estimate for in-memory table variables as regular table variables.

If we flip database compatibility levels to 150, deferred compilation kicks in. Great. Are you on SQL Server 2019? Are you using compatibility level 150?

Don’t get too excited.

Let’s give this a test run in compat level 140:

DECLARE @i INT = 22656;
EXEC dbo.TableVariableTest @Id = @i;
SQL Server Query Plan
everything counts in large amounts

Switching over to compat level 150:

SQL Server Query Plan
yeaaahhhhh

Candy Girl


So what do memory optimized table variables solve?

Not the problem that table variables in general cause.

They do help you avoid tempdb contention, but you trade that off for them taking up space in memory.

Precious memory.

Do you have enough memory?

Thanks for reading!

Going Further


If this is the kind of SQL Server stuff you love learning about, you’ll love my training. I’m offering a 75% discount to my blog readers if you click from here. I’m also available for consulting if you just don’t have time for that and need to solve performance problems quickly.

When Index Sort Direction Matters For Query Performance In SQL Server

Ever Helpful


I got a mailbag question recently about some advice that floats freely around the internet regarding indexing for windowing functions.

But even after following all the best advice that Google could find, their query was still behaving poorly.

Why, why why?

Ten Toes Going Up


Let’s say we have a query that looks something like this:

SELECT
    u.DisplayName,
    u.Reputation,
    p.Score, 
    p.PostTypeId
FROM dbo.Users AS u
JOIN
(
    SELECT
        p.Id,
    	p.OwnerUserId,
    	p.Score,
    	p.PostTypeId,
    	ROW_NUMBER() OVER
    	(
    	    PARTITION BY
    		    p.OwnerUserId,
    			p.PostTypeId
    		ORDER BY
    		    p.Score DESC
    	) AS n
    FROM dbo.Posts AS p
) AS p
    ON  p.OwnerUserId = u.Id
    AND p.n = 1
WHERE u.Reputation >= 500000
ORDER BY u.Reputation DESC,
         p.Score DESC;

Without an index, this’ll drag on forever. Or about a minute.

But with a magical index that we heard about, we can fix everything!

Ten Toes Going Down


And so we create this mythical, magical index.

CREATE INDEX bubble_hard_in_the_double_r
ON dbo.Posts
(
    OwnerUserId ASC, 
    PostTypeId ASC, 
    Score ASC
);

But there’s still something odd in our query plan. Our Sort operator is… Well, it’s still there.

SQL Server Query Plan
grinch

Oddly, we need to sort all three columns involved in our Windowing Function, even though the first two of them are in proper index order.

OwnerUserId and PostTypeId are both in ascending order. The only one that we didn’t stick to the script on is Score, which is asked for in descending order.

Dram Team


This is a somewhat foolish situation, all around. One column being out of order causing a three column sort is… eh.

We really need this index, instead:

CREATE INDEX bubble_hard_in_the_double_r
ON dbo.Posts
(
    OwnerUserId ASC, 
    PostTypeId ASC, 
    Score DESC
);
SQL Server Query Plan
mama mia

Granted, I don’t know that I like this plan at all without parallelism and batch mode, but we’ve been there before.

Thanks for reading!

Going Further


If this is the kind of SQL Server stuff you love learning about, you’ll love my training. I’m offering a 75% discount to my blog readers if you click from here. I’m also available for consulting if you just don’t have time for that and need to solve performance problems quickly.

Mind Your OUTPUT Targets In SQL Server, Some Of Them Hurt Query Performance

Browser History


I’ve blogged about OUTPUT a couple times, and those posts are Still Accurate™

But it’s worth noting that, for the second post OUTPUT forced the query to run serially with no target; just returning data back to SSMS.

Depending on the query behind the putting of the out, parallelism could be quite important.

That’s why in the first post, the put out into a real table didn’t cause performance to suffer.

Of course, if you OUTPUT into a table variable, you still have to deal with table variables being crappy about modifications.

Samesies


If you compare the performance of queries that output into a @table variable vs one that outputs into a #temp table, you’ll see a difference:

SQL Server Query Plan
bang bang bang

Even though the parallel zone is limited here, there’s a big difference in overall query time. Scanning the Votes table singe-threaded vs. in parallel.

When you’re designing processes to be as efficient as possible, paying attention to details like this can make a big difference.

Thanks for reading!

Going Further


If this is the kind of SQL Server stuff you love learning about, you’ll love my training. I’m offering a 75% discount to my blog readers if you click from here. I’m also available for consulting if you just don’t have time for that and need to solve performance problems quickly.

When Does Scalar UDF Inlining Work In SQL Server?

The Eye


UPDATE: After writing this and finding the results fishy, I reported the behavior described below in “Somewhat Surprising” and “Reciprocal?” and it was confirmed a defect in SQL Server 2019 CU8, though I haven’t tested earlier CUs to see how far back it goes. If you’re experiencing this behavior, you’ll have to disable UDF inlining in another way, until CU releases resume in the New Year.

With SQL Server 2019, UDF inlining promises to, as best it can, inline all those awful scalar UDFs that have been haunting your database for ages and making queries perform terribly.

But on top of the long list of restrictions, there are a number of other things that might inhibit it from kicking in.

For example, there’s a database scoped configuration:

ALTER DATABASE SCOPED CONFIGURATION SET TSQL_SCALAR_UDF_INLINING = ON/OFF; --Toggle this

SELECT 
    dsc.*
FROM sys.database_scoped_configurations AS dsc
WHERE dsc.name = N'TSQL_SCALAR_UDF_INLINING';

There’s a function characteristic you can use to turn them off:

CREATE OR ALTER FUNCTION dbo.whatever()
RETURNS something
WITH INLINE = ON/OFF --Toggle this
GO

And your function may or not even be eligible:

SELECT 
    OBJECT_NAME(sm.object_id) AS object_name,
    sm.is_inlineable
FROM sys.sql_modules AS sm
JOIN sys.all_objects AS ao
    ON sm.object_id = ao.object_id
WHERE ao.type = 'FN';

Somewhat Surprising


One thing that caught me off guard was that having the database in compatibility level 140, but running the query in compatibility level 150 also nixed the dickens out of it.

DBCC FREEPROCCACHE;
GO 

ALTER DATABASE StackOverflow2013 SET COMPATIBILITY_LEVEL = 140;
GO 

WITH Comments AS 
(
    SELECT
        dbo.serializer(1) AS udf, --a function
        ROW_NUMBER() 
            OVER(ORDER BY 
                     c.CreationDate) AS n
    FROM dbo.Comments AS c
)
SELECT 
    c.*
FROM Comments AS c
WHERE c.n BETWEEN 1 AND 100
OPTION(USE HINT('QUERY_OPTIMIZER_COMPATIBILITY_LEVEL_150'), MAXDOP 8);
GO

Our query has all the hallmarks of one that has been inflicted with functions:

SQL Server Query Plan
it can’t go parallel

And if you’re on SQL Server 2016+, you can see that it executes once per row:

SELECT 
    OBJECT_NAME(defs.object_id) AS object_name,
    defs.execution_count,
    defs.total_worker_time,
    defs.total_physical_reads,
    defs.total_logical_writes,
    defs.total_logical_reads,
    defs.total_elapsed_time
FROM sys.dm_exec_function_stats AS defs;
SQL Server Query Plan
rockin’ around

Reciprocal?


There’s an odd contradiction here, though. If we repeat the experiment setting the database compatibility level to 150, but running the query in compatibility level 140, the function is inlined.

DBCC FREEPROCCACHE;
GO 

ALTER DATABASE StackOverflow2013 SET COMPATIBILITY_LEVEL = 150;
GO 

WITH Comments AS 
(
    SELECT
        dbo.serializer(c.Id) AS udf,
        ROW_NUMBER() 
            OVER(ORDER BY 
                     c.CreationDate) AS n
    FROM dbo.Comments AS c
)
SELECT 
    c.*
FROM Comments AS c
WHERE c.n BETWEEN 1 AND 100
OPTION(USE HINT('QUERY_OPTIMIZER_COMPATIBILITY_LEVEL_140'), MAXDOP 8);
GO

Rather than seeing a non-parallel plan, and non-parallel plan reason, we see a parallel plan, and an attribute telling us that a UDF has been inlined.

SQL Server Query Plan
call hope

And if we re-check the dm_exec_function_stats DMV, it will have no entries. That seems more than a little bit weird to me, but hey.

I’m just a lowly consultant on SSMS 18.6

Thanks for reading!

Going Further


If this is the kind of SQL Server stuff you love learning about, you’ll love my training. I’m offering a 75% discount to my blog readers if you click from here. I’m also available for consulting if you just don’t have time for that and need to solve performance problems quickly.

Annoyances When Indexing For Windowing Functions In SQL Server

One Day


I will be able to not care about this sort of thing. But for now, here we are, having to write multiple blogs in a day to cover a potpourri of grievances.

Let’s get right to it!

First, without a where clause, the optimizer doesn’t think that an index could improve one single, solitary metric about this query. We humans know better, though.

WITH Votes AS 
(
    SELECT
        v.Id,
        ROW_NUMBER() 
            OVER(PARTITION BY 
                     v.PostId 
                 ORDER BY 
                     v.CreationDate) AS n
    FROM dbo.Votes AS v
)
SELECT *
FROM Votes AS v
WHERE v.n = 0;

The tough part of this plan will be putting data in order to suit the Partition By, and then the Order By, in the windowing function.

Without any other clauses against columns in the Votes table, there are no additional considerations.

Two Day


What often happens is that someone wants to add an index to help the windowing function along, so they follow some basic guidelines they found on the internet.

What they end up with is an index on the Partition By, Order By, and then Covering any additional columns. In this case there’s no additional Covering Considerations, so we can just do this:

CREATE INDEX v2 ON dbo.Votes(PostId, CreationDate);

If you’ve been following my blog, you’ll know that indexes put data in order, and that with this index you can avoid needing to physically sort data.

SQL Server Query Plan
limousine

Three Day


The trouble here is that, even though we have Cost Threshold For Parallelism (CTFP) set to 50, and the plan costs around 195 Query Bucks, it doesn’t go parallel.

Creating the index shaves about 10 seconds off the ordeal, but now we’re stuck with this serial calamity, and… forcing it parallel doesn’t help.

Our old nemesis, repartition streams, is back.

SQL Server Query Plan
wackness

Even at DOP 8, we only end up about 2 seconds faster. That’s not a great use of parallelism, and the whole problem sits in the repartition streams.

This is, just like we talked about yesterday, a row mode problem. And just like we talked about the day before that, windowing functions generally do benefit from batch mode.

Thanks for reading!

Going Further


If this is the kind of SQL Server stuff you love learning about, you’ll love my training. I’m offering a 75% discount to my blog readers if you click from here. I’m also available for consulting if you just don’t have time for that and need to solve performance problems quickly.

An Overlooked Benefit Of Batch Mode For Parallel Query Plans In SQL Server

Make It Count


When queries go parallel, you want them to be fast. Sometimes they are, and it’s great.

Other times they’re slow, and you end up staring helplessly at a repartition streams operator.

SQL Server Query Plan
brick wall

Sometimes you can reduce the problem with higher DOP hints, or better indexing, but overall it’s a crappy situation.

Snap To


Let’s admire a couple familiar looking queries, because that’s been working really well for us so far.

WITH Comments AS 
(
    SELECT
        ROW_NUMBER() 
            OVER(PARTITION BY 
                     c.UserId
                 ORDER BY 
                     c.CreationDate) AS n
    FROM dbo.Comments AS c
)
SELECT *
FROM Comments AS c
WHERE c.n = 0
OPTION(USE HINT('QUERY_OPTIMIZER_COMPATIBILITY_LEVEL_140'));

WITH Comments AS 
(
    SELECT
        ROW_NUMBER() 
            OVER(PARTITION BY 
                     c.UserId
                 ORDER BY 
                     c.CreationDate) AS n
    FROM dbo.Comments AS c
)
SELECT *
FROM Comments AS c
WHERE c.n = 0
OPTION(USE HINT('QUERY_OPTIMIZER_COMPATIBILITY_LEVEL_150'));

One is going to run in compatibility level 140, the other in 150, as foretold by ancient alien prophecy.

The two query plans will have a bit in common, but…

SQL Server Query Plan
just batch

The second query, which runs in batch mode, runs about 15 seconds faster. One big reason why is that we skip that most unfortunate repartition streams operator.

It’s a cold sore. An actual factual cold sore.

The only ways I’ve found to fix it completely are:

  • Induce batch mode
  • Use the parallel apply technique

But the parallel apply technique doesn’t help much here, because of local factors.

In this case, me generating the largest possible result set and then filtering it down to nothing at the end.

Thanks for reading!

Going Further


If this is the kind of SQL Server stuff you love learning about, you’ll love my training. I’m offering a 75% discount to my blog readers if you click from here. I’m also available for consulting if you just don’t have time for that and need to solve performance problems quickly.

Making The Most Of Temp Tables In SQL Server Part 1: Fully Parallel Inserts

Sing Along


If you have a workload that uses #temp tables to stage intermediate results, and you probably do because you’re smart, it might be worth taking advantage of being able to insert into the #temp table in parallel.

Remember that you can’t insert into @table variables in parallel, unless you’re extra sneaky. Don’t start.

If your code is already using the SELECT ... INTO #some_table pattern, you’re probably already getting parallel inserts. But if you’re following the INSERT ... SELECT ... pattern, you’re probably not, and, well, that could be holding you back.

Pile On


Of course, there are some limitations. If your temp table has indexes, primary keys, or an identity column, you won’t get the parallel insert no matter how hard you try.

The demo code is available here if you’d like to test it out.

SQL Server Query Plan
amanda lear

The first thing to note is that inserting into an indexed temp table, parallel or not, does slow things down. If your goal is the fastest possible insert, you may want to create the index later.

No Talent


When it comes to parallel inserts, you do need the TABLOCK, or TABLOCKX hint to get it, e.g. INSERT #tp WITH(TABLOCK) which is sort of annoying.

But you know. It’s the little things we do that often end up making the biggest differences. Another little thing we may need to tinker with is DOP.

SQL Server Query Plan
little pigs

Here are the query plans for 3 fully parallel inserts into an empty, index-less temp #table. Note the execution times dropping as DOP increases. At DOP 4, the insert really isn’t any faster than the serial insert.

If you start experimenting with this trick, and don’t see noticeable improvements at your current DOP, you may need to  bump it up to see throughput increases.

Also remember that if you’re doing this with clustered column store indexes, it can definitely make things worse.

Page Supplier


Though the speed ups above at higher DOPs are largely efficiency boosters while reading from the Posts table, the speed does stay consistent through the insert.

If we crank one of the queries that gets a serial insert up to DOP 12, we lose some speed when we hit the table.

SQL Server Query Plan
oops

Next time you’re tuning a query and want to drop some data into a temp table, you should experiment with this technique.

Thanks for reading!

Going Further


If this is the kind of SQL Server stuff you love learning about, you’ll love my training. I’m offering a 75% discount to my blog readers if you click from here. I’m also available for consulting if you just don’t have time for that and need to solve performance problems quickly.