If this is the kind of SQL Server stuff you love learning about, you’ll love my training. I’m offering a 75% discount to my blog readers if you click from here. I’m also available for consulting if you just don’t have time for that and need to solve performance problems quickly.
In SQL Server, troubleshooting blocking problems is a pain. It’s one of those things you really have to be monitoring for pretty actively in order to catch the full extent of it.
You might catch glimpses of it in sp_WhoIsActive or sp_BlitzWho, but it’s really hard to get the full picture and blocking chain for the duration of the event.
This is much easier done via dedicated monitoring tools, where the GUI will often give you a tree view of the blocking.
These are generally more helpful to identify which queries were being blocked, but still not who was doing the blocking.
Regular wait stats (i.e. from sys.dm_os_wait_stats) have no association to the queries that caused them.
If you’re on SQL Server 2017 or better, and you’re using Query Store, you can get a look at those waits with a query like this:
SELECT   qsws.wait_category_desc,
         SUM(qsws.total_query_wait_time_ms) / 1000. AS total_query_wait_time_s,
         AVG(qsws.avg_query_wait_time_ms) / 1000. AS avg_query_wait_time_s,
         MAX(qsws.max_query_wait_time_ms) / 1000. AS max_query_wait_time_s
FROM     sys.query_store_wait_stats AS qsws
GROUP BY qsws.wait_category_desc
ORDER BY total_query_wait_time_s DESC;
The view of your wait stats is far less detailed, but at least it’s only this one database. Look, at least you get that.
With that out of the way, let’s take that simple query and make a couple minor adjustments to get some other information out.
WITH qs_waits AS (
SELECT   qsws.wait_category_desc,
         qsws.plan_id,
         SUM(qsws.total_query_wait_time_ms) / 1000. AS total_query_wait_time_s,
         AVG(qsws.avg_query_wait_time_ms) / 1000. AS avg_query_wait_time_s,
         MAX(qsws.max_query_wait_time_ms) / 1000. AS max_query_wait_time_s
FROM     sys.query_store_wait_stats AS qsws
WHERE qsws.wait_category_desc = 'Lock'
GROUP BY qsws.wait_category_desc, qsws.plan_id
)
SELECT qsw.*,
       r.*,
       p.query_sql_text,
       TRY_CONVERT(XML, p.query_plan) AS query_plan
FROM qs_waits AS qsw
OUTER APPLY
(
    SELECT TOP (1) qsp.plan_id,
                   qsp.query_plan,
                   qsqt.query_sql_text
    FROM sys.query_store_plan AS qsp
    JOIN sys.query_store_query AS qsq
        ON qsq.query_id = qsp.query_id
    JOIN sys.query_store_query_text AS qsqt
        ON qsq.query_text_id = qsqt.query_text_id
    WHERE qsw.plan_id = qsp.plan_id
    ORDER BY qsp.last_execution_time DESC
) AS p
OUTER APPLY
(
    SELECT TOP (1) qsrs.avg_duration / 1000. AS avg_duration,
                   qsrs.avg_cpu_time / 1000. AS avg_cpu_time
    FROM sys.query_store_runtime_stats AS qsrs
    WHERE qsrs.plan_id = p.plan_id
    ORDER BY qsrs.last_execution_time DESC
) AS r;
There we go.
Nice, clean, simple, but most important totally intuitive. I love how easy it is to quickly get the information you want.
?
Lookin’ For Locks
That query will get information about queries which waited on Locks — that’s why we’re getting plan_id up in our CTE.
After that, we’re getting the plan and text of any queries that waited on locks, and a couple vanity metrics.
Growing Away
Only one query waited on locks. Make a couple notes here, though:
avg_query_wait_time is 21 seconds
avg_query_duration is 21 seconds
avg_cpu_time is 0.12 seconds
My workload is Highly Contrived™ so the avg wait and query duration line up. In real life, you probably won’t have queries that were only ever waiting on locks to be released.
But it’s worth making some comparisons like this when you’re having blocking problems, especially when you tie wait times and durations in with cpu time.
If cpu is very low but duration is high, generally, you’ve found blocked queries.
Collectiving
Looking at the text and plan, we can also reasonably surmise that this read query wasn’t blocking anything.
But Still…
This doesn’t tell us what query was blocking the select. If you want to figure that out, you’ve got some options:
Sure, you could also go digging through DMVs to find modification queries that last ran around the same time, but I’ve hit a lot of dead ends there.
A lot of this pain would go away if SQL Server were optimistic by default, or if you’re allowed to enable an optimistic isolation level.
And remember: Queries taking locks don’t register locking waits. Only queries being blocked register locking waits.
Thanks for reading!
Going Further
If this is the kind of SQL Server stuff you love learning about, you’ll love my training. I’m offering a 75% discount to my blog readers if you click from here. I’m also available for consulting if you just don’t have time for that and need to solve performance problems quickly.
Yes, indexed view maintenance can be quite rough. I don’t mean like, rebuilding them. I will never talk about that.
I mean that, in some cases locks are serializable, and that if you don’t mind your indexes you may find run-of-the-mill modifications taking quite a long time.
Let’s go look!
Mill Town
Let’s get update a small chunk of the Posts table.
BEGIN TRAN
UPDATE p
SET p.Score += 100
FROM dbo.Posts AS p
WHERE p.OwnerUserId = 22656;
ROLLBACK
Let’s all digress from the main point of this post for a moment!
It’s generally useful to give modifications an easy path to find data they need to update. For example:
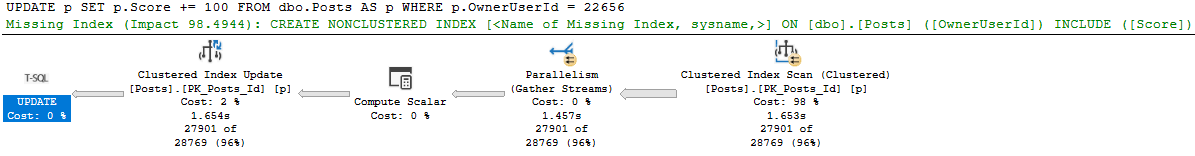
Uh no
This update takes 1.6 seconds because we have no useful index on OwnerUserId. But we get a daft missing index request, because it wants to include Score, which would mean we’d need to then update that index as well as read from it. Locking leads to NOLOCK hints. I tend to want to introduce as little of it as possible.
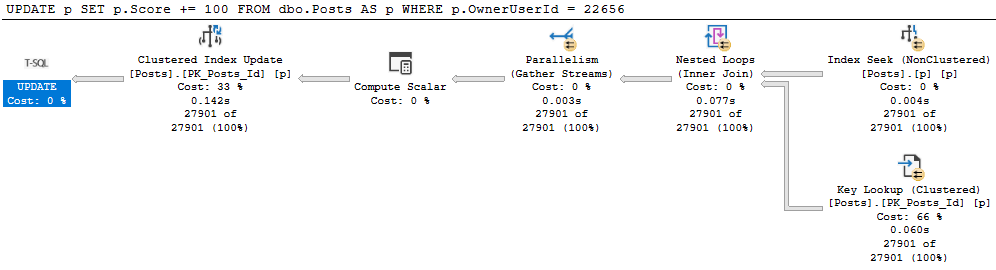
With an index on just OwnerUserId, our situation improves dramatically.
100000X IMPROVEMENT
Allow Me To Reintroduce Myself
Let’s see what happens to our update with an indexed view in place.
CREATE OR ALTER VIEW dbo.PostScoresVotes
WITH SCHEMABINDING
AS
SELECT   p.Id,
         SUM(p.Score * 1.0) AS ScoreSum,
		 COUNT_BIG(v.Id) AS VoteCount,
		 COUNT_BIG(*) AS OkayThen
FROM     dbo.Posts AS p
JOIN     dbo.Votes AS v
    ON p.Id = v.PostId
WHERE p.PostTypeId = 2
AND   p.CommunityOwnedDate IS NULL
GROUP BY p.Id;
GO

CREATE UNIQUE CLUSTERED INDEX c_Id
    ON dbo.PostScoresVotes(Id);
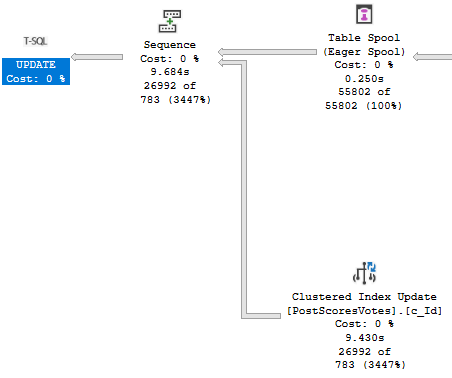
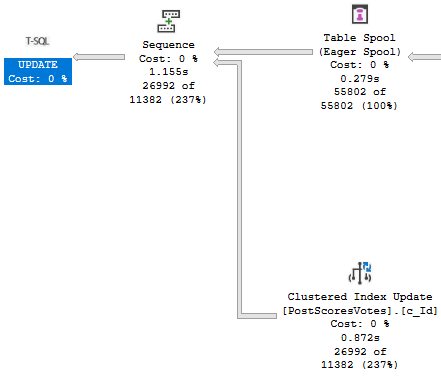
Our update query now takes about 10 seconds…
Oof dawg
With the majority of the time being spent assembling the indexed view for maintenance.
Yikes dawg
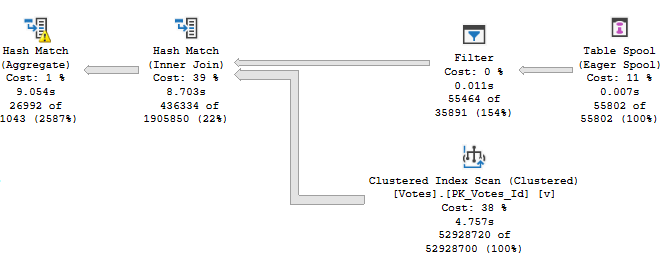
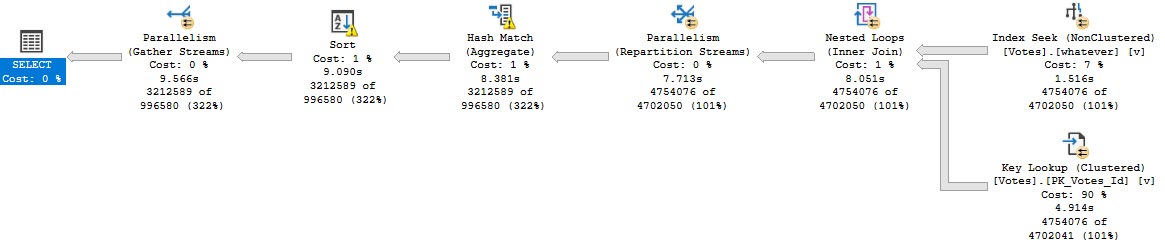
The Problem Of Course
Is that our indexes are bad. We’ve got no helpful index between Posts and Votes to help with the assembly.
Our first clue may have been when creating the indexed view took a long time, but hey.
Let’s fix it.
CREATE INDEX v ON dbo.Votes(PostId);
Now our update finishes in about a second!
Cleant Up
Thanks for reading!
Going Further
If this is the kind of SQL Server stuff you love learning about, you’ll love my training. I’m offering a 75% discount to my blog readers if you click from here. I’m also available for consulting if you just don’t have time for that and need to solve performance problems quickly.
If this is the kind of SQL Server stuff you love learning about, you’ll love my training. I’m offering a 75% discount to my blog readers if you click from here. I’m also available for consulting if you just don’t have time for that and need to solve performance problems quickly.
I’ll sometimes see people implement retry logic to catch deadlocks, which isn’t a terrible idea by itself. The problem that may arise is when the deadlock monitor takes a full 5 seconds to catch a query, which can block other queries, and may generally make things feel slower.
Different Locks
An alternative is to set a lock timeout that’s shorter than five seconds.
DECLARE @lock_try INT = 0

WHILE @lock_try < 5
BEGIN
    BEGIN TRY

        SET LOCK_TIMEOUT 5; /*five milliseconds*/

        SELECT COUNT(*) AS records FROM dbo.Users AS u;

    END TRY
    BEGIN CATCH

        IF ERROR_NUMBER() <> 1222 /*Lock request time out period exceeded.*/
		RETURN;

    END CATCH;

SET @lock_try += 1;

WAITFOR DELAY '00:00:01.000' /*Wait a second and try again*/

END;
While 5 milliseconds is maybe an unreasonably short time to wait for a lock, I’d rather you start low and go high if you’re trying this at home. The catch block is set up to break if we hit an error other than 1222, which is what gets thrown when a lock request times out.
This is a better pattern than just hitting a deadlock, or just waiting for a deadlock to retry. Normally when a deadlock occurs, one query throws an error, and there’s no attempt to try it again (unless a user is sitting there hitting submit until something works). Waiting ~5 seconds (I know I’m simplifying here, and the deadlock monitor will wake up more frequently after it detects one)
The big question is: are you better off doing this in T-SQL than in your application?
Thanks for reading!
Going Further
If this is the kind of SQL Server stuff you love learning about, you’ll love my training. I’m offering a 75% discount to my blog readers if you click from here. I’m also available for consulting if you just don’t have time for that and need to solve performance problems quickly.
I seem to have gotten quite a few questions about this lately, so I’m going to write down some thoughts here.
It’s probably crappy form for a blog post, but what the heck.
Queries Decide The Isolation Level
They can choose anything from read uncommitted to serializable. Read uncommitted is the more honest term for what’s going on. When people see the “nolock” hint, they often assume that means their query won’t take any locks. What it really means is that it will ignore locks taken by other queries. The more accurate term would be “norespect”. This is probably what leads to confusion: reading uncommitted data sounds different than not locking data. But they’re both the same.
The Storage Engine Decides Which Locks Are Used
And if lock escalation is attempted. The storage engine will respect the query’s isolation level, and any table-level settings related to lock granularity, like not allowing row or page locks. It may not fully respect any query level hints regarding lock granularity.
One thing that helps reduce the chance of lock escalation is having a good index to help your modification query find rows. Though if you need to find a million rows, don’t expect SQL Server to happily take a million row locks, just because of an index.
Batching modifications is one way to avoid lock escalation when you need to modify a lot of rows, though it isn’t always possible to do this. If for some reason you need to roll the entire change back, you’d have to keep track of all the committed batches somewhere, or wrap the entire thing in a transaction (which would defeat the purpose, largely).
One thing that increases the chance of lock escalation is having many indexes present on a table. For inserts and deletes, all of those indexes will get touched (unless they’re filtered around the rows to be inserted or deleted. For updates, any indexes containing the column(s) to be modified will need to be touched (again, barring filtering around the updated portion). Lock counts are cumulative across objects.
Not All “Blocking” Is “Locking”
In other words, when you see queries being blocked, there may not be an LCK wait involved. Some “blocking” can happen with resource contention, whether it’s physical (CPU, memory, disk), logical (like if there’s latch or spinlock contention), or even programmatic (if you’re lucky enough to see the source code).
This can happen in tempdb if you’re creating a lot of objects rapid-fire, even if you’re using table variables. Table variables can avoid some of the overhead that temp tables incur under high frequency execution, but not all of it.
Thanks for reading!
Going Further
If this is the kind of SQL Server stuff you love learning about, you’ll love my training. I’m offering a 75% discount to my blog readers if you click from here. I’m also available for consulting if you just don’t have time for that and need to solve performance problems quickly.
Today we’re going to look at how unused indexes add to locking problems.
Hold My Liquor
Going Further
If this is the kind of SQL Server stuff you love learning about, you’ll love my training. I’m offering a 75% discount to my blog readers if you click from here. I’m also available for consulting if you just don’t have time for that and need to solve performance problems quickly.
Under most circumstances, this won’t happen. Most.
Shared locks taken by read queries will let go pretty quickly.
Under most circumstances.
Out, Liars
To hold onto Shared locks, you’d need to use an isolation level escalation hint, like REPEATABLE READ.
I could do that here if I were a lazy cheater.
Instead, I’m going to show you a more common and interesting scenario.
You see, like a lot of important specks of knowledge, this one comes from Craig Freedman:
Note the “WITH UNORDERED PREFETCH” keywords on the nested loops join.
I am not going to demontrate it , but when SQL Server executes this query, it holds S locks on the rows returned by the index seek until the query finishes executing.
I’m going to be a little bit of a lazy cheater here, and rather than show you where this can happen with parameter sniffing or some other weird optimizer choice, I’m going to use an index hint to use this index:
CREATE INDEX whatever ON dbo.Votes(CreationDate, VoteTypeId);
Then I’m going to run this query, which’ll take about 10 seconds:
DECLARE @i INT
SELECT   @i = v.PostId
FROM     dbo.Votes AS v WITH (INDEX = whatever)
WHERE    v.CreationDate >= '20080101'
AND      v.VoteTypeId > 5
GROUP BY v.PostId
ORDER BY v.PostId;
Here’s what the query plan looks like:
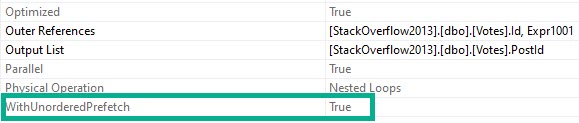
Your My Best Wishes
And when we get the properties of the Nested Loops Join, we’ll see the Unordered Prefetch property set to true.
Steve Prefetchtaine
If I kick that query off and look at the results of sp_WhoIsActive @get_locks = 1, I’ll see this:
Which is exactly what I want — a Shared object lock on Votes that has been GRANTed. That’ll get held onto for the duration of the query.
Now when I try to run this update, it’ll get blocked:
BEGIN TRAN
UPDATE dbo.Votes SET UserId = 2147483647
ROLLBACK
Note that I’m only wrapping it in a transaction here so it’ll roll back. It will still get blocked without that, but then I’d have to reverse the update on my own.
And Who Is Active is showing us that the read query has been blocking the write query for around 4 seconds.
Capper
If you’re out there in the world and you see a read query that blocked a write query, take a close look at the query plan for a Nested Loops Join with the Unordered Prefetch property set to true.
I bet you’ll find one. And I’ll bet your query wasn’t fast.
Fixing the Key Lookup may not make your query faster, but it should alleviate the blocking because of long-held shared locks.
Thanks for reading!
Going Further
If this is the kind of SQL Server stuff you love learning about, you’ll love my training. I’m offering a 75% discount to my blog readers if you click from here. I’m also available for consulting if you just don’t have time for that and need to solve performance problems quickly.
Indexes remind me of salt. And no, not because they’re fun to put on slugs.
More because it’s easy to tell when there’s too little or too much indexing going on. Just like when you taste food it’s easy to tell when there’s too much or too little salt.
Salt is also one of the few ingredients that is accepted across the board in chili.
To continue feeding a dead horse, the amount of indexing that each workload and system needs and can handle can vary quite a bit.
Appetite For Nonclustered
I’m not going to get into the whole clustered index thing here. My stance is that I’d rather take a chance having one than not having one on a table (staging tables aside). Sort of like a pocket knife: I’d rather have it and not need it than need it and not have it.
At some point, you’ve gotta come to terms with the fact that you need nonclustered indexes to help your queries.
But which ones should you add? Where do you even start?
Let’s walk through your options.
If Everything Is Awful
It’s time to review those missing index requests. My favorite tool for that is sp_BlitzIndex, of course.
Now, I know, those missing index requests aren’t perfect.
I’m gonna share an industry secret with you: No one else looking at your server for the first time is going to have a better idea. Knowing what indexes you need often takes time and domain/workload knowledge.
If you’re using sp_Blitzindex, take note of a few things:
How long the server has been up for: Less than a week is usually pretty weak evidence
The “Estimated Benefit” number: If it’s less than 5 million, you may wanna put it to the side in favor of more useful indexes in round one
Duplicate requests: There may be several requests for indexes on the same table with similar definitions that you can consolidate
Insane lists of Includes: If you see requests on (one or a few key columns) and include (every other column in the table), try just adding the key columns first
Of course, I know you’re gonna test all these in Dev first, so I won’t spend too much time on that aspect ?
If One Query Is Awful
You’re gonna wanna look at the query plan — there may be an imperfect missing index request in there.
Hip Hop Hooray
And yeah, these are just the missing index requests that end up in the DMVs added to the query plan XML.
They’re not any better, and they’re subject to the same rules and problems. And they’re not even ordered by Impact.
Cute. Real cute.
sp_BlitzCache will show them to you by Impact, but that requires you being able to get the query from the plan cache, which isn’t always possible.
If You Don’t Trust Missing Index Requests
And trust me, I’m with you there, think about the kind of things indexes are good at helping queries do:
Find data
Join data
Order data
Group data
Keeping those basic things in mind can help you start designing much smarter indexes than SQL Server can give you.
You can start finding all sorts of things in your query plans that indexes might change.
If this is the kind of SQL Server stuff you love learning about, you’ll love my training. I’m offering a 75% discount to my blog readers if you click from here. I’m also available for consulting if you just don’t have time for that and need to solve performance problems quickly.
Let’s say we have a super important query. It’s not really important.
None of this is important.
SELECT   u.DisplayName, u.Reputation, u.CreationDate
FROM     dbo.Users AS u
WHERE    u.CreationDate >= DATEADD(DAY, DATEDIFF(DAY, 0, GETDATE()), 0)
AND      u.Reputation < 6
ORDER BY u.CreationDate DESC;
Maybe it’ll find users who created accounts in the last day who haven’t gotten any upvotes.
Shocking find, I know.
An okay index to help us find data and avoid sorting data would look like this:
CREATE INDEX ix_apathy
    ON dbo.Users(CreationDate DESC, Reputation);
So now we know whose fault it is that we have this index, and we know who to blame when this happens.
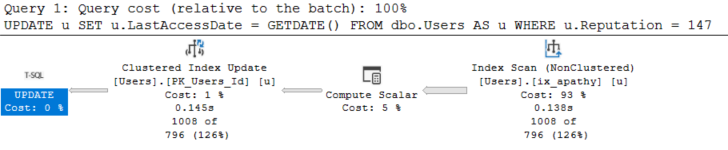
Blocko
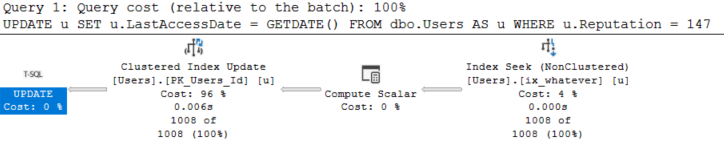
UPDATE u
SET u.LastAccessDate = GETDATE()
FROM dbo.Users AS u
WHERE u.Reputation = 147;
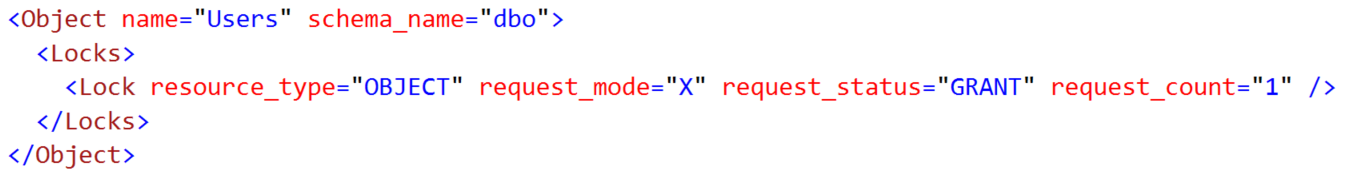
ScannoObjectified
What’s going on here is that the optimizer chooses our narrower index to find data to update.
It’s helpful because we read far less pages than we would if we just scanned the clustered index, but the Reputation column being second means we can’t seek to rows we want.
The optimizer isn’t asking for a missing index here, either (okay, I don’t blame it for a query that runs in 145ms, but stick with me).
Switcheroo
If we change our index to have Reputation first, something nice happens.
To this query.
CREATE INDEX ix_whatever
    ON dbo.Users(Reputation, CreationDate DESC);
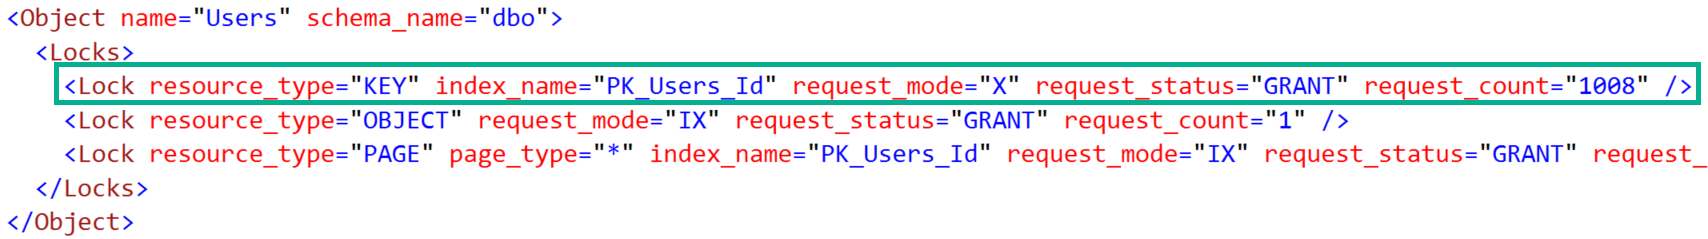
SoughtOnly Keys Now
With index order switched, we take more fine-grained locks, and we take them for a shorter period of time.
All That For This
If you have a locking problem, here’s what you should do:
Look at your modification queries that have WHERE clauses, and make sure they have the right indexes
Look at your modification queries that modify lots of rows, and try batching them
If your critical read and write queries are at odds with each other, look into an optimistic isolation level
Thanks for reading!
Going Further
If this is the kind of SQL Server stuff you love learning about, you’ll love my training. I’m offering a 75% discount to my blog readers if you click from here. I’m also available for consulting if you just don’t have time for that and need to solve performance problems quickly.