How To Use sp_HumanEvents To Troubleshoot A Slow Stored Procedure In SQL Server

Number One Record


You’ve got a stored procedure that runs slowly, but the problem is that it’s… long. It’s really hard to tell which part is slow, sometimes.

With shorter procedures you can probably just collect actual execution plans and slam F5 like a tall glass of gin at 6am.

But you don’t wanna do that with the larger procedures, for a few practical reasons:

  • Lots of little queries run quickly, and we don’t care about those
  • Navigating through lots of plans in SSMS is tedious
  • There’s no differentiation when other procedures, etc. are invoked
  • You introduce a lot of overhead retrieving and rendering all those plans
  • The full query text might not be captured, which is a limitation in many places

Let’s save the day with sp_HumanEvents, my stored procedure that makes using Extended Events really easy.

Wanna Ride


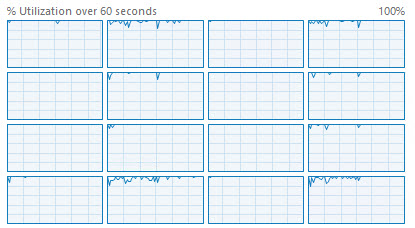
There are a lot of issues you can run into with Extended Events. They’re rather unpleasant, and there’s almost zero guidance from Microsoft about usage.

Wouldn’t it be nice to just hit F5?

Once you have a window open with your procedure ready to run, take note of the session id that it’s using, and tailor this command for your situation:

EXEC sp_HumanEvents
    @event_type = 'query',                   
    @query_duration_ms = 1000,               
    @session_id = N'58',                    
    @keep_alive = 1;

Let’s break down what this does:

  • The events we want to focus on are for executed queries
  • We only care about queries that run for more than one second
  • We’re going to focus in on the session id for the query window we’re tuning in
  • We want the session to stay running so we can watch and re-watch after we make changes

I know it looks a little funny that @session_id is a string, but that’s because there are some sampling capabilities if you want to look at a workload instead of a single procedure without overwhelming a server by collecting everything.

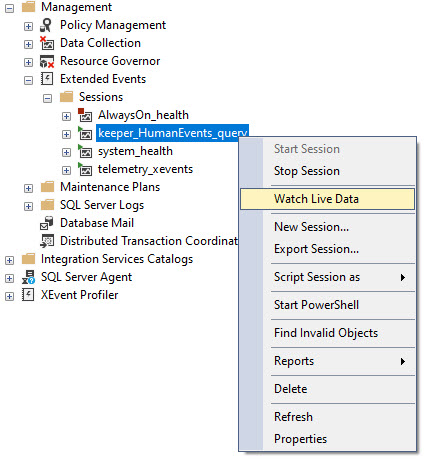
Once that’s done, you’ll have a new Extended Event session like this, and you’ll wanna watch live data from it:

SQL Server Extended Events
big bux

Watch Out Now


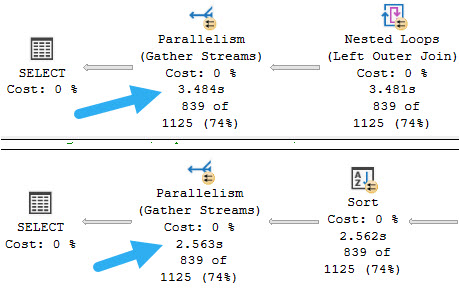
Once you’ve got that window open and you run your procedure, you’ll see any queries that meet the duration criteria, and you should see something that looks like this.

SQL Server Extended Events
good for you


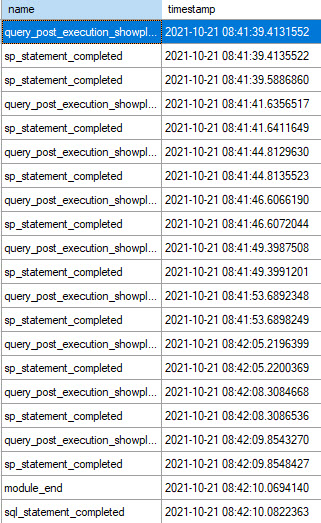
The procedure that I’m looking at in here is sp_BlitzCache, because it’s a good example of a procedure with a lot of queries in it, where only some of them (like the XML parsing) might get slowed down.

Some notes on the output:

  • The statement doesn’t get collected with the query plan (more on that in a second)
  • INSERT…EXEC shows up as two statements (lines 2 and 3 over there)

You only see these two columns at first, but you can go through and add in any other columns that you find useful from each specific session type.

Two Point Two


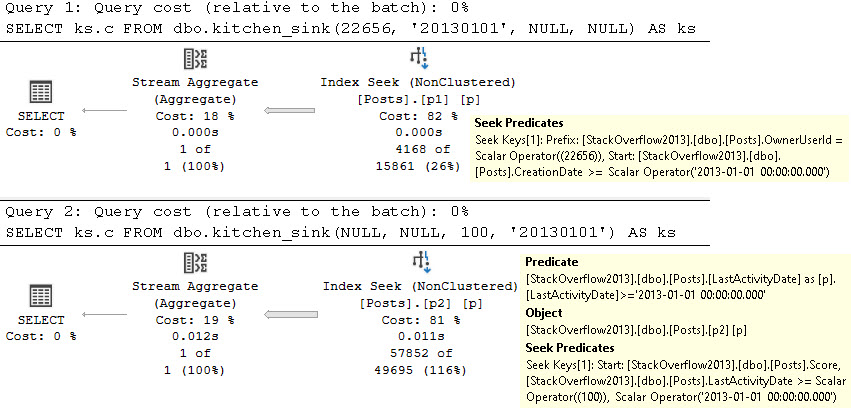
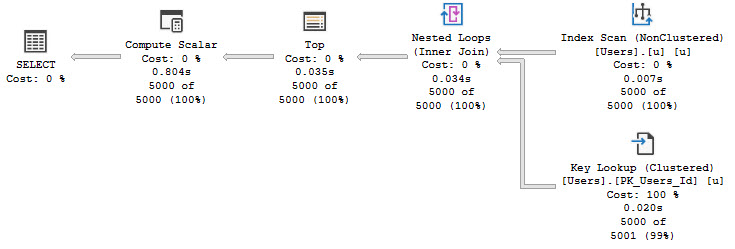
The output can be a little confusing at first. Generally the pattern is query plan, then statement associated with it.

If you click on each event, you can choose different elements from it to show in the main result window.

SQL Server Extended Events
like you

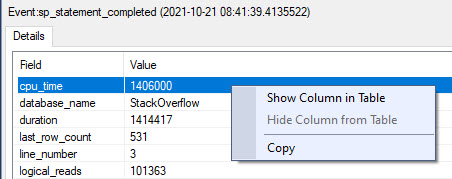
Here’s how I usually set things up to find what I wanna go after:

SQL Server Extended Events
get it

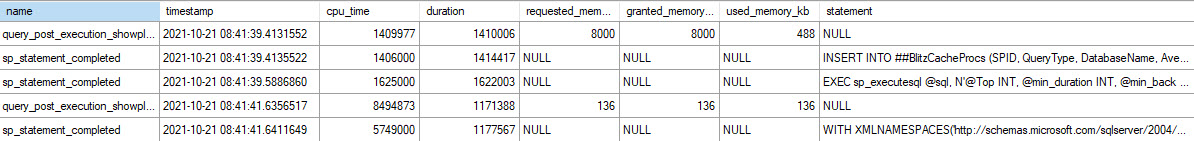
I like to grab CPU, duration, information about requested, granted, and used memory, and the statement.

Not every element is available in every event. Where things are NULL, that’s where they’re not available. I wish there were a general extended event that captured everything I need in one go, but that doesn’t seem to exist.

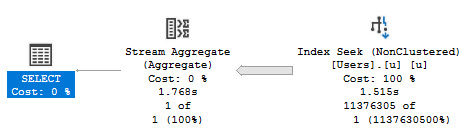
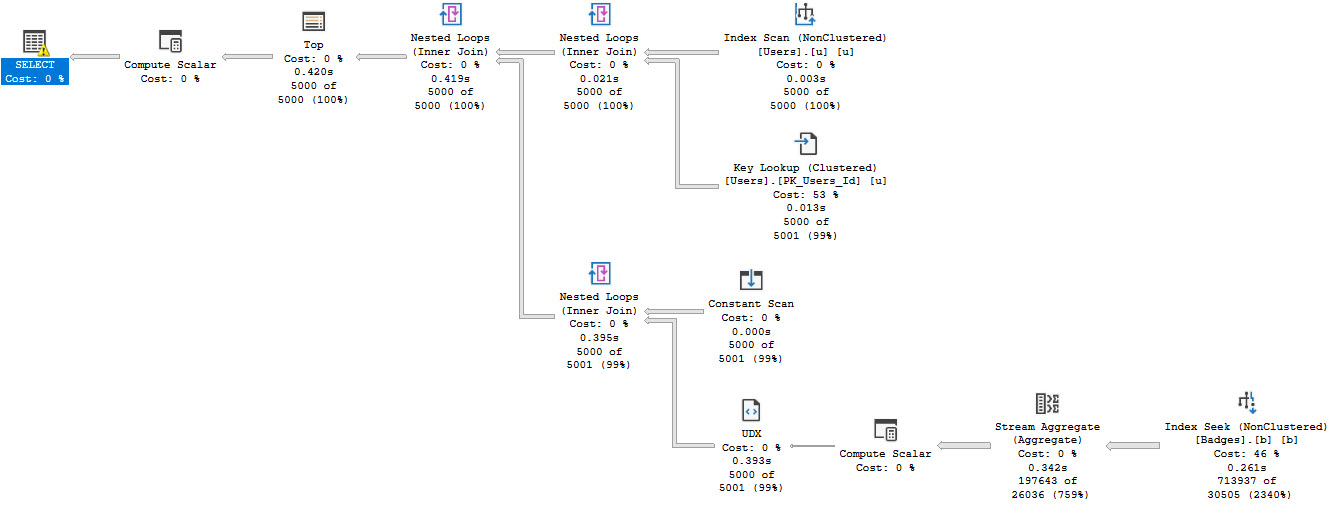
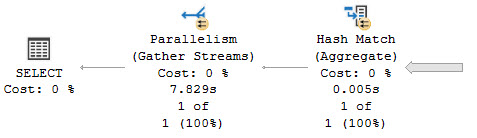
One last point on the output is that if you click on the query_post_execution_showplan lines, the query plan is available in the second result set:
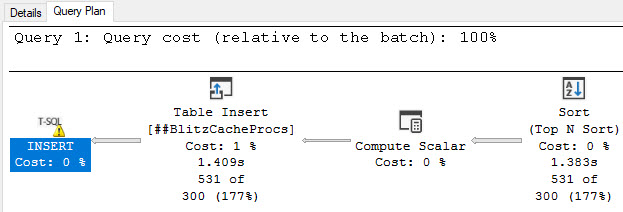
SQL Server Query Plan
one time

Crossover


Before you ask, the lightweight profiling events are useless. They’re so nerfed and collect so little helpful detail that you might as well be looking at a cached plan or Query Store plan.

Lightweight, baby 🙄

To that point, I don’t recommend running something like this across a whole workload. Though Extended Events are purported to have far less observer overhead than Profiler, I’ve seen even heavily-filtered sessions like this slow workloads down quite a bit.

That goes for other traces and forms of monitoring as well. Don’t think this is a special case.

Anyway, this is how I work when I’m trying to tune things for clients. Hopefully you find it useful as well.

Grab sp_HumanEvents and lemme know how it goes on GitHub.

Thanks for reading.

Going Further


If this is the kind of SQL Server stuff you love learning about, you’ll love my training. I’m offering a 75% discount to my blog readers if you click from here. I’m also available for consulting if you just don’t have time for that and need to solve performance problems quickly.

Inline Table Valued Functions And Catch All Queries In SQL Server

This Is Not A Solution


Right off the bat, I want you to know that this is not a solution, and I’ll get to why in a minute. I’m writing this mainly because every once in a while I’ll try something different to get this working, and it always ends up disappointing.

I wish I had better news for you, here. Hell, I wish I had better news for me here. But alas we’re at the mercy of parameters.

And yeah, I know, recompile, recompile, recompile. All the live long day. But I’ve seen some weird stuff happen with that too under high concurrency.

So what’s the point? Let’s talk about that.

Dot Dot Dot


CREATE INDEX p1 ON dbo.Posts(OwnerUserId, CreationDate);

CREATE INDEX p2 ON dbo.Posts(Score, LastActivityDate);

We need some indexes. That’s a fact. I’m intentionally creating them in this way to show you that SQL Server can sometimes be smart about catch all queries.

And here’s the inline table valued function we’ll be working with:

CREATE OR ALTER FUNCTION
    dbo.kitchen_sink
(
    @OwnerUserId int,
    @CreationDate datetime,
    @Score int,
    @LastActivityDate datetime
)
RETURNS table
AS
RETURN
SELECT
    c = COUNT_BIG(*)
FROM dbo.Posts AS p
WHERE 
        (p.OwnerUserId = @OwnerUserId OR @OwnerUserId IS NULL)
    AND (p.CreationDate >= @CreationDate OR @CreationDate IS NULL)
    AND (p.Score >= @Score OR @Score IS NULL)
    AND (p.LastActivityDate >= @LastActivityDate OR @LastActivityDate IS NULL);

This pattern usually eats the optimizer alive, and there’s a lot of posts about using dynamic SQL to fix it.

But when we call this function with literal values, it does just fine.

SELECT
    ks.c
FROM dbo.kitchen_sink(22656, '20130101', NULL, NULL) AS ks;

SELECT
    ks.c
FROM dbo.kitchen_sink(NULL, NULL, 100, '20130101') AS ks;

SELECT
    ks.c
FROM dbo.kitchen_sink(22656, NULL, NULL, '20130101') AS ks;

SELECT
    ks.c
FROM dbo.kitchen_sink(NULL, '20131225', NULL, '20131225') AS ks;

SELECT
    ks.c
FROM dbo.kitchen_sink(22656, NULL, NULL, '20131215') AS ks;

Das Plan


You can run those all yourself and look at the plans. I’m just gonna throw a couple of the more interesting examples in the post, though.

The first two queries do exactly what we’d hope to see.

SQL Server Query Plan
sparkling

We use the right indexes, we get seeks. Cardinality estimation is about as reliable as ever with the “””””default””””” estimator in place 🙄

And at one point, we even get a really smart index intersection plan where the optimizer uses both of our nonclustered indexes.

SQL Server Query Plan
units

Parameter Problem


The problem is that no one really makes database calls like that.

If you’re using an ORM, you could intentionally not parameterize your queries and get this to “work”, but there are downsides to that around the plan cache. Being honest, most plan caches are useless anyway.

Long Live Query Store, or something.

Most people have their catch all code parameterized, so the query looks like what’s in the function. I’m going to throw the function in a stored procedure now.

CREATE OR ALTER PROCEDURE
    dbo.kitchen_wrapper
(
    @OwnerUserId int,
    @CreationDate datetime,
    @Score int,
    @LastActivityDate datetime
)
AS
BEGIN
SET NOCOUNT, XACT_ABORT ON;

    SELECT
        ks.c
    FROM dbo.kitchen_sink
    (
        @OwnerUserId, 
        @CreationDate, 
        @Score, 
        @LastActivityDate
    ) AS ks;

END;

If we execute the proc like this, everything goes to hell rather quickly.

EXEC dbo.kitchen_wrapper
    @OwnerUserId = 22656,          
    @CreationDate = '20131215',    
    @Score = NULL,                  
    @LastActivityDate = NULL;

EXEC dbo.kitchen_wrapper
    @OwnerUserId = NULL,
    @CreationDate = NULL, 
    @Score = 100, 
    @LastActivityDate = '20131215';

Baywatch


The first execution uses the “right” index, but we lose our nice index seek into the p1 index.

SQL Server Query Plan
barfbag

We also end up with Predicates on the Key Lookup, just in case they end up not being NULL. And boy, when they end up not being NULL, we end up with a really slow query.

SQL Server Query Plan
me one too

We re-use the execution plan we saw before, because that’s how SQL Server works. But since we don’t filter any rows from p1 since those parameters are NULL now, we pass all 17 million rows to the key lookup to filter them there, but since it’s a Nested Loops Join, we do it… one row at a time.

Fun.

Floss Too Much


There’s no great fix for this, either. This is a problem we’re stuck with when we write queries this way without using dynamic SQL, or a recompile hint.

I’ve seen people try all sorts of things to “fix” this problem. Case expressions, ISNULL and COALESCE, magic values, and more. They all have this exact same issue.

And I know, recompile, recompile, recompile.

Thanks for reading!

Going Further


If this is the kind of SQL Server stuff you love learning about, you’ll love my training. I’m offering a 75% discount to my blog readers if you click from here. I’m also available for consulting if you just don’t have time for that and need to solve performance problems quickly.

An Annoying OPTIMIZE FOR Limitation In SQL Server

Infrequent


I have occasionally cheated a little and used OPTIMIZE FOR some_value to fix a parameter sniffing issue that didn’t have any other viable options available to it.

This is a pretty rare situation, but there’s a place for everything. Keep in mind that I’m not talking about UNKNOWN here. I’m talking about a real value.

Recently I had to fix a specific problem where cardinality estimates for datetime values would get completely screwed up if they were older than a day.

You’d be tempted to call this an ascending key problem, but it was really an ascending key solution. Whenever a query got an off histogram estimate, it chose a good plan — when it got a histogram step hit, the estimate was high by several million rows, and the plan looked like someone asked for all the rows in all the databases in all the world.

So, you go through the usual troubleshooting steps:

  • More frequent stats updates: uh oh, lots of recompiles
  • Stats updates with fullscan during maintenance: crapped out during the day
  • Various trace flags and acts of God: Had the opposite effect
  • Is my query doing anything dumb? Nope.
  • Are my indexes eating crayons? Nope.

Drawing Board


The problem with OPTIMIZE FOR is that… it’s picky. You can’t just optimize for anything.

For example, you can’t do this:

DECLARE 
    @s datetime = '19000101'''

SELECT 
    c = COUNT_BIG(*)
FROM dbo.Users AS u
WHERE u.CreationDate >= @s
OPTION
(
    OPTIMIZE FOR (@s = GETDATE())
);

And you can’t do this:

DECLARE 
    @s datetime = '19000101',
    @d datetime = GETDATE()

SELECT 
    c = COUNT_BIG(*)
FROM dbo.Users AS u
WHERE u.CreationDate >= @s
OPTION
(
    OPTIMIZE FOR (@s = @d)
);

We get a nasty message.

Msg 320, Level 15, State 1, Line 26
The compile-time variable value for ‘@s’ in the OPTIMIZE FOR clause must be a literal.

Ever Heard Of A Chef Who Can’t Cook?


The solution is, as usual, dynamic SQL, but there’s a catch. Because there’s always a catch.

For example this works, but if you run it a minute or so apart, you get multiple plans in the cache.

DBCC FREEPROCCACHE;

DECLARE
    @sql nvarchar(MAX) = N'',
    @s datetime = '19000101',
    @d datetime = GETDATE(),
    @i int = 0;

WHILE @i < 10
BEGIN
    
    SELECT
       @sql = N'
        SELECT 
            c = COUNT_BIG(*)
        FROM dbo.Users AS u
        WHERE u.CreationDate >= @s
        OPTION
        (
            OPTIMIZE FOR (@s = ''' + CONVERT(nvarchar(30), @d) + ''')
        );     
       ';
    
    EXEC sys.sp_executesql
        @sql,
        N'@s datetime',
        @s;
    
    SELECT 
        @i += 1;
    
END

EXEC sp_BlitzCache 
    @DatabaseName = 'StackOverflow';
dangit

Are You Ready For Some Date Math?


Depending on how we want to address this, we can either:

  • Do some date math to go to the beginning of the current day
  • Do some date math to go to the end of the current day
  • Set the value to the furthest possible date in the future

The first two cases should generally be fine. Saying the quiet part out loud, not a lot of plans survive a long time, either due to plan cache instability or other recompilation events, like from stats updates.

If you’re super-picky about that, go with the third option. This may also be considered the safest option because a stats update might give you a histogram for today’s value. The datetime max value will theoretically “never” be a histogram step value, but that depends on if you let users do Stupid Things™

DBCC FREEPROCCACHE;

DECLARE
    @sql nvarchar(MAX) = N'',
    @s datetime = '19000101',
    @d datetime = '99991231',
    @i int = 0;

WHILE @i < 10
BEGIN
    
    SELECT
       @sql = N'
        SELECT 
            c = COUNT_BIG(*)
        FROM dbo.Users AS u
        WHERE u.CreationDate >= @s
        OPTION
        (
            OPTIMIZE FOR (@s = ''' + CONVERT(nvarchar(30), @d) + ''')
        );     
       ';
    
    EXEC sys.sp_executesql
        @sql,
        N'@s datetime',
        @s;
    
    SELECT 
        @i += 1;
    
END

No matter how many times you run this, the plan will get reused and you’ll always have the off-histogram step.

Qualifying Events?


This is one of those “good ideas” I have for a specific circumstance without any other easy workarounds. I don’t suggest it as a general practice, and it certainly has some drawbacks that would make it dangerous in other circumstances.

I can’t easily reproduce the problem this solved locally, but I can show you why you probably don’t want to make it a habit.

SQL Server Query Plan
eek

In cases where you are able to get good cardinality estimates, this will hamper it greatly.

So, you know, last resort.

Thanks for reading!

Going Further


If this is the kind of SQL Server stuff you love learning about, you’ll love my training. I’m offering a 75% discount to my blog readers if you click from here. I’m also available for consulting if you just don’t have time for that and need to solve performance problems quickly.

Be Careful Where You Call Inline Table Valued Functions In SQL Server Queries

Keep’em Comin!


While helping someone tame a bunch of rather unfortunate scalar valued functions, we eventually hit a point where they were able to do some of the rewrites themselves. During testing, they ran into a situation where performance got worse when they made the switch over, and it wasn’t because an Eager Index Spool popped up.

I was able to come up with a demo that shows a reasonable enough performance difference in a couple queries using the same technique as I gave them to fix things.

So uh, here goes that.

Muppet


The query they were tuning had a couple OUTER APPLYs already written into it, and so they added the function on as another.

SELECT
    u.DisplayName,
    b.Name,
    nbi.AvgPostsPerDay
FROM dbo.Users AS u
OUTER APPLY
(
    SELECT 
        CreationDate = 
            MIN(p.CreationDate)
    FROM dbo.Posts AS p
    JOIN dbo.Votes AS v
        ON  v.PostId = p.Id
        AND v.VoteTypeId = 1
    WHERE p.OwnerUserId = u.Id
) AS p
OUTER APPLY
(
    SELECT TOP (1)
        b.Name
    FROM dbo.Badges AS b
    WHERE b.UserId = u.Id
    ORDER BY b.Date DESC
) AS b
OUTER APPLY dbo.no_bueno_inline(u.Id, p.CreationDate) AS nbi
WHERE u.Reputation >= 100000
ORDER BY u.Reputation DESC;

Since they didn’t want to lose rows to the function, they couldn’t use CROSS APPLY. Good enough.

Moutarde


But what they really wanted was to move the function up into the select list, like this:

SELECT
    u.DisplayName,
    b.Name,
    AvgPostsPerDay = 
    (
        SELECT 
            nbi.AvgPostsPerDay 
        FROM dbo.no_bueno_inline
        (
            u.Id, 
            p.CreationDate
        ) AS nbi
    )
FROM dbo.Users AS u
OUTER APPLY
(
    SELECT 
        CreationDate = 
            MIN(p.CreationDate)
    FROM dbo.Posts AS p
    JOIN dbo.Votes AS v
        ON  v.PostId = p.Id
        AND v.VoteTypeId = 1
    WHERE p.OwnerUserId = u.Id
) AS p
OUTER APPLY
(
    SELECT TOP (1)
        b.Name
    FROM dbo.Badges AS b
    WHERE b.UserId = u.Id
    ORDER BY b.Date DESC
) AS b
WHERE u.Reputation >= 100000
ORDER BY u.Reputation DESC;

That way you don’t lose any rows like you could with CROSS APPLY, and the optimizer is more likely to holler at the function later on in the query plan, since the values from it are only being projected — that’s fancy for selected.

Mapperoo


The full query plan is a bit much to untangle quickly in this post, but the timing difference is noticeable enough for my purposes:

SQL Server Query Plan
tootin

So if you ever end up rewriting a scalar valued function as an inline table valued function, make sure you test calling it in the same way. Moving query syntax around may produce logically equivalent results, but won’t always produce equivalent performance.

Thanks for reading!

Going Further


If this is the kind of SQL Server stuff you love learning about, you’ll love my training. I’m offering a 75% discount to my blog readers if you click from here. I’m also available for consulting if you just don’t have time for that and need to solve performance problems quickly.

My SQL Server Query Ran For A Long Time But Didn’t Use A Lot Of CPU: What Happened?

Of Walls And Clocks


No one ever says a broken record is right twice a day, perhaps because DJs are far more replaceable than clock makers.

I say that only to acknowledge that I may sound like a broken record when I say that when you’re tuning a query, it’s quite important to compare wall clock time and duration. Things you should note:

  • If CPU and duration were about equal in a serial plan, that’s normal
  • If CPU is much higher than duration in a parallel plan, that’s normal
  • If duration and CPU are about equal in a parallel plan, you’ve got yourself a situation
  • If duration is much higher than CPU in any plan, something else held your query up

In this post, I’m going to outline a non-exhaustive list of reasons why that last bullet point just might be.

Hammer Time


Big Data: One common reason you may run into is that you’re returning a large result set, either locally to SSMS, or to an app server that is either overloaded or underpowered. It’s also possible that something is happening on the application side that’s slowing things down. In these cases, you’ll usually see a lot of ASYNC_NETWORK_IO waits. To better test the speed of the actual query, you can dump the results into a #temp table.

Blocking: Another quite common issue is that the query you’re running is getting blocked. Before you go reaching for that NOLOCK hint, make sure you know what it does. Blocking is each to check on with sp_WhoIsActive. If you see your query waiting on waits that start with LCK_ Some common ones are LCK_M_SCH_S, LCK_M_SCH_M, LCK_M_S, LCK_M_U, LCK_M_X, LCK_M_IS, LCK_M_IU, LCK_M_IX. While your query is being blocked, it’s just gonna rack up wall clock time, while using zero CPU.

Stats updates: Once in a while I’ll run into a query that runs slowly the first time and fast the second time because behind the scenes the query had to wait on stats to update. It’s a bit hard to figure out unless you’re on SQL Server 2019, but it can totally make your query look like you sat around doing nothing for a chunk of time, especially if you’re waiting on large tables, or a bunch of smaller updates.

Reading from disk: If the tables or indexes you’re reading are bigger than your buffer pool, your queries are gonna eat it going to disk to read data in. If this is your limitation, you’ll see a lot of PAGIOLATCH_SH or PAGEIOLATCH_EX waits, depending on if your query is reading data, writing data, or both.

Waiting for a worker thread: When your queries can’t get a worker thread to run on, they end up waiting on THREADPOOL. While some waits on it are to be expected, you don’t want queries to wait long periods of time on this. It’s a serious sign your server is jammed way up.

Waiting for memory: When your queries can’t get the memory grant they want, they sit around waiting on RESOURCE_SEMAPHORE. Just like above, it’s a sure sign your server is having problems if it’s a wait you see occurring a lot, or for long average periods of time.

Waiting for a query plan: I know, this sounds like a long compilation time — and it sort of is — but only because the query is waiting a long time to get memory to compile an execution plan. This wait is going to be RESOURCE_SEMAPHORE_QUERY_COMPILE, instead.

Query Plan Compilation: Sometimes the optimizer gets a bit carried away and spend a whole bunch of time in search2 trying to reorder joins, and do other tricks to make your query faster. Under extreme circumstances, you might wait a really long time for that query plan. There’s no wait stats to tell you that, but if you look at your query plan’s properties (F4 key on the root operator), you can see the compile time.

SQL Server Query Plan
yeesh.

Thanks for reading!

Going Further


If this is the kind of SQL Server stuff you love learning about, you’ll love my training. I’m offering a 75% discount to my blog readers if you click from here. I’m also available for consulting if you just don’t have time for that and need to solve performance problems quickly.

UDF Inlining And String Aggregations In SQL Server 2019

Quatro Enemigos


This post is really four different posts. Maybe five. The main points are:

Let’s start at the top, because tops are top.

Strung Out


If you’re like me and you got excited by the induction of STRING_AGG into the T-SQL Lexicon because of all the code odd-balling it would replace, you were likely also promptly disappointed for a few reasons.

  • Needing to convert the element to be AGGed to a MAX to avoid errors
    • STRING_AGG aggregation result exceeded the limit of 8000 bytes. Use LOB types to avoid result truncation
  • The WITHIN GROUP ordering is clunky compared to an outer ORDER BY (but hey, logical query processing…)
  • No support for DISTINCT in the function, and an outer DISTINCT tries to make the wrong thing DISTINCT (see above)

And of course, it’s a breaking limitation for UDF inlining.

The UDF does not reference the STRING_AGG function

Let’s look at all of that stuff at once, in one function.

CREATE OR ALTER FUNCTION 
    dbo.IsStringAgg (@UserId int)
RETURNS 
    nvarchar(max)
WITH 
    RETURNS NULL ON NULL INPUT, 
    SCHEMABINDING
AS
BEGIN
RETURN
(
    SELECT
        STRING_AGG
        (
            CONVERT
            (
                nvarchar(MAX),
                b2.Name
            ), 
            N', '
        )
        WITHIN GROUP 
        (
            ORDER BY 
                b2.Name
        )
    FROM
    (
        SELECT DISTINCT 
            b.Name
        FROM dbo.Badges AS b
        WHERE b.UserId = @UserId
    ) AS b2
);
END;
GO

Not exactly  a thing of beauty, is it? Let’s hold onto that for one second, though.

XML > JSON


Okay, so let’s get back to that UDF documentation.

The UDF does not reference XML methods

That sort of reads like NOXML4U, which is my friend Jeremiah’s license plate. In reality though, it means all the .method thingies, like value, node, query, etc.

So if you were to try to follow my prior advice on string concatenation, the function couldn’t be inlined.

SELECT
   x = 
   (
       SELECT 
           [text()] = 
               b.Name
       FROM dbo.Badges AS b
       WHERE b.Id = 100564
       FOR XML 
           PATH(''),
           TYPE
   ).value
     (
         './text()[1]', 
         'nvarchar(max)'
     );

Having the .value breaks inlining. So there’s that. I believe this is where Reddit users post something like le sigh with some poorly drawn stick figure.

Del The Funktion


We can write the function semi-correctly like so:

CREATE OR ALTER FUNCTION 
    dbo.NotStringAgg (@UserId int)
RETURNS 
    nvarchar(max)
WITH 
    RETURNS NULL ON NULL INPUT, 
    SCHEMABINDING
AS
BEGIN
RETURN
    STUFF
    (
        (
            SELECT
                N', ' + 
                b.Name
            FROM dbo.Badges AS b
            WHERE b.UserId = @UserId
            GROUP BY b.Name
            ORDER BY b.Name
            FOR XML PATH (N'')
        ), 
        1,
        2,
        N''
    );
END;
GO

Alright, now let’s BRING THAT CODE BACK (air horn)

Sea Vessel Soliloquy


If we compare the execution plans for these two functions, the XML one gets inlined, and the STRING_AGG one does not.

SELECT TOP (5000)
    u.DisplayName,
    ThanksForAllYourHardWork = 
        dbo.NotStringAgg(u.Id)
FROM dbo.Users AS u
ORDER BY u.Reputation DESC;
GO 

SELECT TOP (5000)
    u.DisplayName,
    ThanksForAllYourHardWork = 
        dbo.IsStringAgg(u.Id)
FROM dbo.Users AS u
ORDER BY u.Reputation DESC;
GO

Here’s the plan for the inlined function:

SQL Server Query Plan
blaze it

Here’s the plan for the non-inlined function:

SQL Server Query Plan
thin ice

Stay Thirsty


The inlined function finishes about twice as fast, though one may pause for a moment to consider whether the 400ms difference is an earth shattering kaboom in this case.

Of course, the real kicker is when scalar UDFs are invoked as part of larger queries where parallelism, etc. is important.

Thanks for reading!

Going Further


If this is the kind of SQL Server stuff you love learning about, you’ll love my training. I’m offering a 75% discount to my blog readers if you click from here. I’m also available for consulting if you just don’t have time for that and need to solve performance problems quickly.

I/O Bound vs CPU Bound Queries In SQL Server

Handcuffed


When you’re looking for queries to tune, it’s important to understand which part is causing the slowdown.

That’s why Actual Execution plans are so valuable in newer versions of SQL Server and SSMS. Getting to see operator timing and wait stats for a query can tell you a lot about what kind of problem you’re facing.

Let’s take a look at some examples.

Diskord


If you’re looking at a query plan, and all the time is spent way to the right, when you’re reading from indexes, it’s usually a sign of one or two things:

  • You’re missing a good index for the query
  • You don’t have enough memory to cache data relevant to the query

If you run the query a second time, and it has the same characteristics — meaning we should now have the data cached in the buffer pool but we don’t — then one or both of those two things is true.

If you run the query a second time and it’s fast because all the data we care about is cached, then it’s more likely that only the second thing is true.

SQL Server Query Plan
wasabi

For example, every time I run this query it takes 20 seconds because every time it has to read the clustered index from disk into memory to get a count. That’s because my VM has 96 GB of RAM, and the clustered index of the Posts table is about 120 GB. I can’t fit the whole thing into the buffer pool, so each time I run this query has the gas station sushi effect on the buffer pool.

If I add a nonclustered index — and keep in mind I don’t really condone adding single key column nonclustered indexes like this — the query finishes much faster, because the smaller nonclustered index takes less time to read, and it fits into the buffer pool.

CREATE INDEX pr ON dbo.Posts
(
    Id
);
SQL Server Query Plan
birthday

If our query had different characteristics, like a where clause, join, group by, order by, or windowing function, I’d consider all of those things for the index definition. Just grabbing a count can still benefit from a smaller index, but there’s nothing relational that we need to account for here.

Proc Rock


Let’s say you already have ideal indexes for a query, but it’s still slow. Then what?

There are lots of possible reasons, but we’re going to examine what a CPU bound query looks like. A good example is one that needs to process a lot of rows, though not necessarily return a lot of rows, like a count or other aggregate.

SQL Server Query Plan
splish splash

While this query runs, CPUs are pegged like suburban husbands.

SQL Server Query Plan
in the middle of the street

For queries of this stature, inducing batch mode is often the most logical choice. Why? Because CPU instructions are run over batches of rows at once, rather than a single row at a time.

With a small number of rows — like in an OLTP workload — you probably won’t notice any real gains. But for this query that takes many millions of rows and produces an aggregate, it’s Hammer Time™

SQL Server Query Plan
known as such

Rather than ~30 seconds, we can get our query down to ~8 seconds without making a single other change to the indexes or written form.

Under Compression


For truly large data sets, compression indexes is a great choice for further reducing I/O bound portions of queries. In SQL Server, you have row, page, and column store (clustered and nonclustered) compression available to you based on the type of workload you’re running.

When you’re tuning a query, it’s important to keep the type of bottleneck you’re facing in mind. If you don’t, you can end up trying to solve the wrong problem and getting nowhere.

Thanks for reading!

Going Further


If this is the kind of SQL Server stuff you love learning about, you’ll love my training. I’m offering a 75% discount to my blog readers if you click from here. I’m also available for consulting if you just don’t have time for that and need to solve performance problems quickly.

Why You Should Stop Looking At Query Costs In SQL Server

Spare No Expense


Over the years, there have been a lot of requests to get sp_BlitzCache to sort results by query cost. I understand why. It’s assumed that the optimizer is never wrong and that cost is directly associated with poor performance.

There are also rather misguided efforts to figure out parallelism settings based on plan costs. The main problem with that being that if you currently have a lot of parallel queries, all that means is that the estimated cost of the serial plan was higher than your current Cost Threshold For Parallelism setting, and the cost of the parallel plan was less than the cost of the serial plan.

If you increase Cost Threshold For Parallelism, you may very well still end up with a parallel plan, because the serial version was still more expensive. If you eventually change Cost Threshold For Parallelism to the point where some queries are no longer eligible for parallelism, you may eventually find yourself unhappy with the performance of the serial version of the query plan.

Albeit with less overall wait time on CX* doodads.

Next you’ll be complaining about all the SOS_SCHEDULER_YIELD waits you’ve got.

Insteads


Rather than look at estimated metrics, you should be looking at how queries actually perform. For most servers I look at, that means looking at queries with high average CPU time, and large memory grants. Those metrics typically represent tunable aspects of the query.

In other cases, you might look at wait stats to direct the type of queries you want to go after. Reads, writes, and executions are also valuable metrics at times.

One danger of looking at totals rather than averages is that you may find things that do a little bit of something a whole lot of times, and there’s no real way to tune the small bit of activity they generate other than to run the query less.

What’s A Cost For?


In general, I only tend to look at costs to figure out plan choices within a query, or when comparing two different plans for “the same” query.

This is where experimenting with hints to change the plan shapes and choices can show you why you got the plan you did, and what you might have to do to get the plan you want naturally.

Let’s say you want to figure out why you got a specific join type. You hint the type of join you want, and there’s a missing index request now. Adding the index gets you the plan shape you want without the hint. Everyone lived happily ever after.

Until the index got fragmented ???

Thanks for reading!

Going Further


If this is the kind of SQL Server stuff you love learning about, you’ll love my training. I’m offering a 75% discount to my blog readers if you click from here. I’m also available for consulting if you just don’t have time for that and need to solve performance problems quickly.

Starting SQL: What To Do When A SQL Server Query Is Slow

I am a heading


Going Further


If this is the kind of SQL Server stuff you love learning about, you’ll love my training. I’m offering a 75% discount to my blog readers if you click from here. I’m also available for consulting if you just don’t have time for that and need to solve performance problems quickly.

Starting SQL: What Cached And Estimated Plans Can And Can’t Tell You In SQL Server

Starting SQL: What Cached And Estimated Plans Can And Can’t Tell You


Going Further


If this is the kind of SQL Server stuff you love learning about, you’ll love my training. I’m offering a 75% discount to my blog readers if you click from here. I’m also available for consulting if you just don’t have time for that and need to solve performance problems quickly.