In the release notes for SQL Server 2017 CU30, there’s a note that it fixes a problem where parameters can’t be pushed passed Sequence Project operators:
“In Microsoft SQL Server 2017, running parameterized queries skips the SelOnSeqPrj rule. Therefore, pushdown does not occur.” But it doesn’t actually do that.
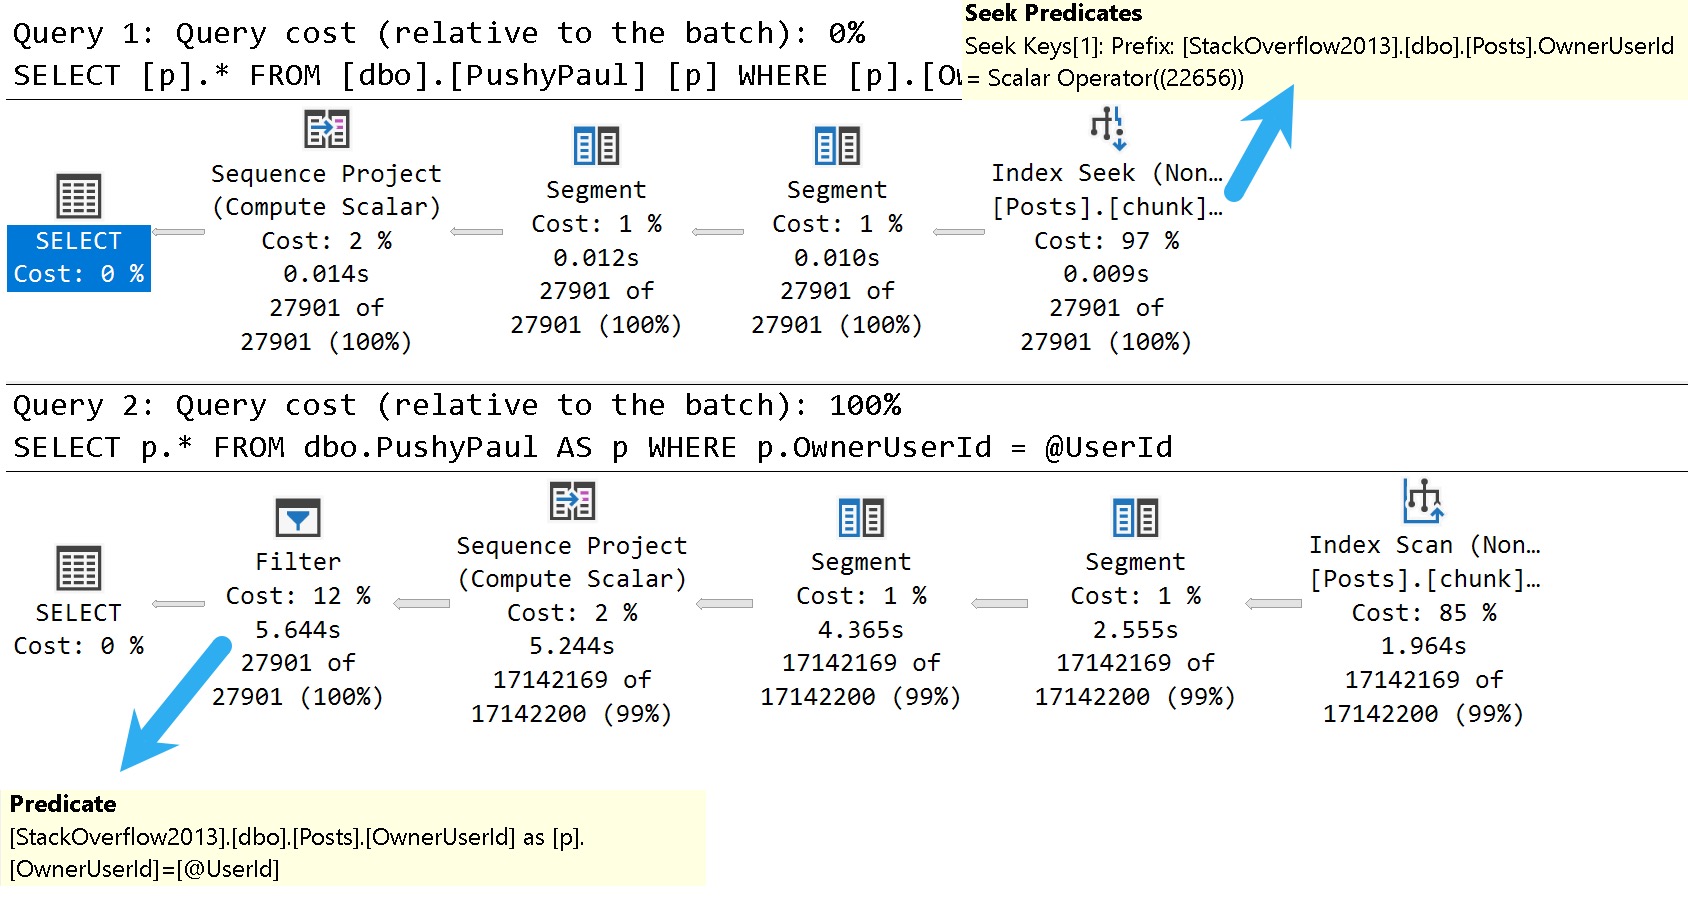
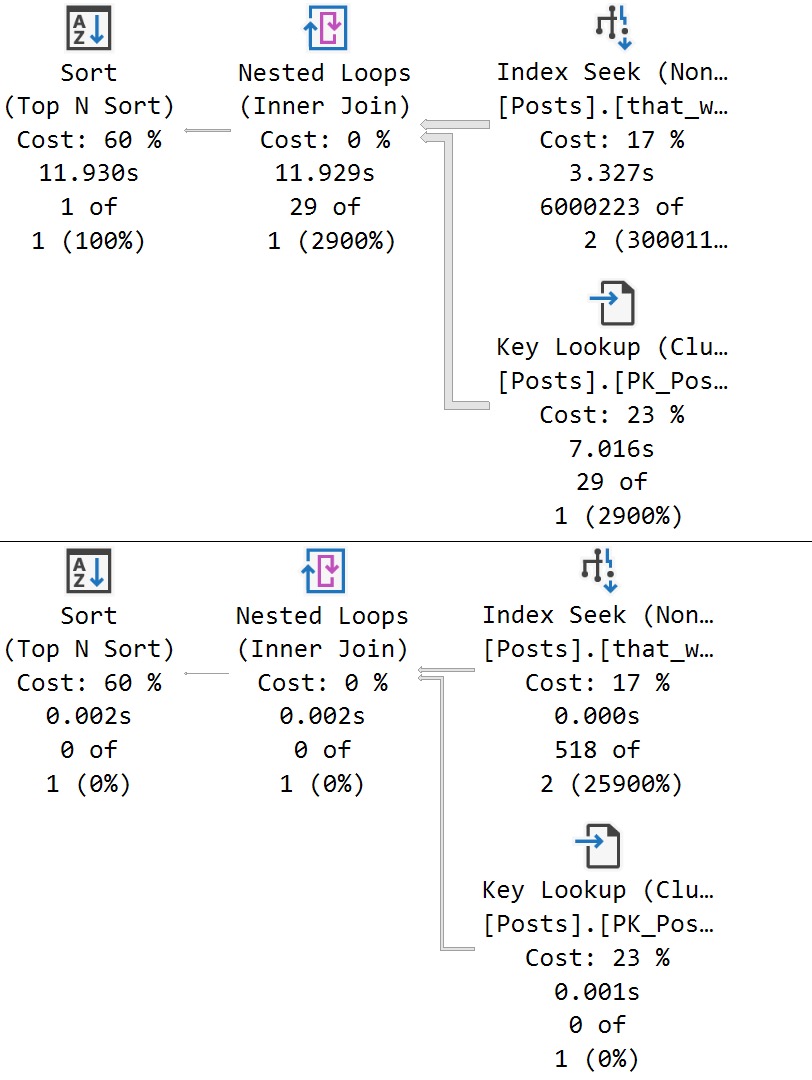
Here are the good and bad plans, comparing using a literal value vs. a parameterized value:
dunksville
In the plan with a literal value, the predicate is applied at the index seek, and the filtering is really quick.
In the plan with a parameterized value, the index is scanned, and applied at a filter way later in the query plan.
This is where the SelOnSeqPrj rule comes in: The parameter can’t be pushed past the Sequence Project operator like the literal value can.
Thanks for reading!
Going Further
If this is the kind of SQL Server stuff you love learning about, you’ll love my training. I’m offering a 75% discount to my blog readers if you click from here. I’m also available for consulting if you just don’t have time for that and need to solve performance problems quickly.
I can’t have my dear friend Brent being all distraught with all those fast cars around. That’s how accidents happen, and I fear he might leave the Blitz scripts to me in his will or something.
In Paul’s post, he talks about using undocumented trace flag 8666 to get additional details about Sort operators.
Let’s do that. Paul is smart, though he is always completely wrong about which season it is.
DROP TABLE IF EXISTS
    dbo.Votes_CCI;

SELECT
    v.*
INTO dbo.Votes_CCI
FROM dbo.Votes AS v;
I’m using the Votes table because it’s nice and narrow and I don’t have to tinker with any string columns.
Strings in databases were a mistake, after all.
DBCC TRACEON(8666);
CREATE CLUSTERED COLUMNSTORE INDEX
    vcci
ON dbo.Votes_CCI
ORDER (Postid);
DBCC TRACEOFF(8666);
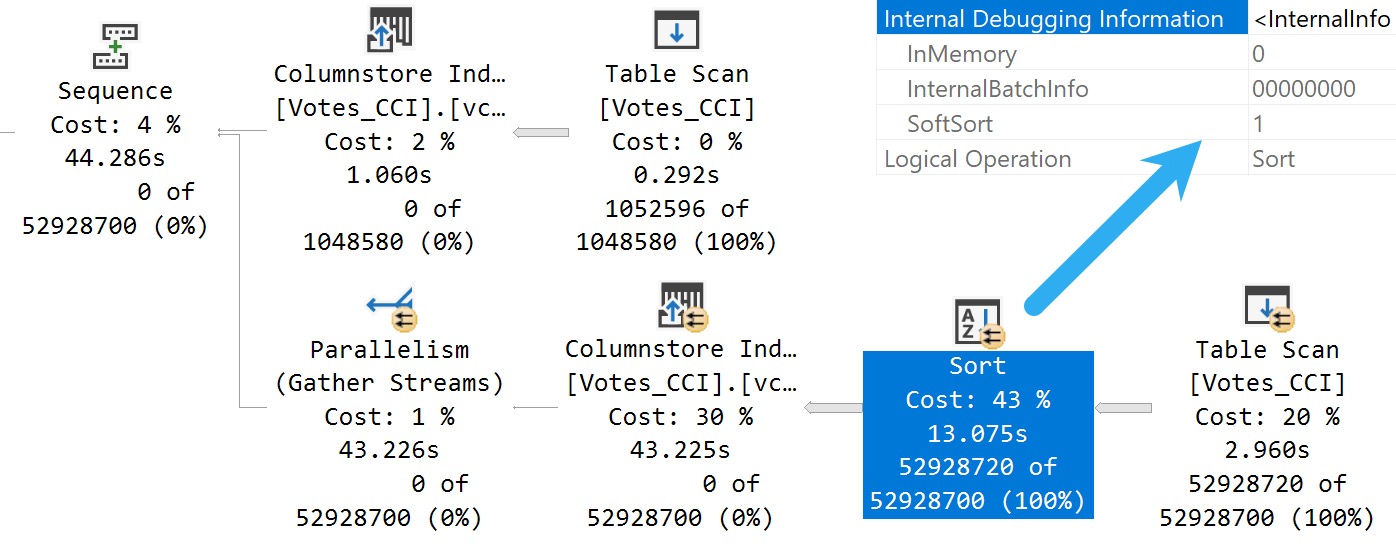
Here’s what we get back in the query plan:
Tainted Sort
We’ve got a Soft Sort! What does our seasonally maladjusted friend say about those?
A “soft sort” uses only its primary memory grant and never spills. It doesn’t guarantee fully-sorted output. Each sort run using the available memory grant will be sorted. A “sort sort” represents a best effort given the resource available. This property can be used to infer that a Sort is implemented with CQScanPartitionSortNew without attaching a debugger. The meaning of the InMemory property flag shown above will be covered in part 2. It does not indicate whether a regular sort was performed in memory or not.
Well, with that attitude, it’s not surprising that there are so many overlapping buckets in the column store index. If it’s not good enough, what can you do?
Building the index with the Soft Sort here also leads to things being as bad as they were in Brent’s post.
Insert Debugging Here
Alas, there’s (almost) always a way. Microsoft keeps making these trace flag things.
There are a bunch of different ways to track them down, but figuring out the behavior of random trace flags that you may find just by enabling them isn’t easy.
One way to tie a trace flag to a behavior is to use WinDbg to step through different behaviors in action, and see if SQL Server checks to see if a trace flag is enabled when that behavior is performed.
If you catch that, you can be reasonably sure that the trace flag will have some impact on the behavior. Not all trace flags can be enabled at runtime. Some need to be enabled as startup options.
Sometimes it’s hours and hours of work to track this stuff down, and other times Paul White (b|t) already has notes on helpful ones.
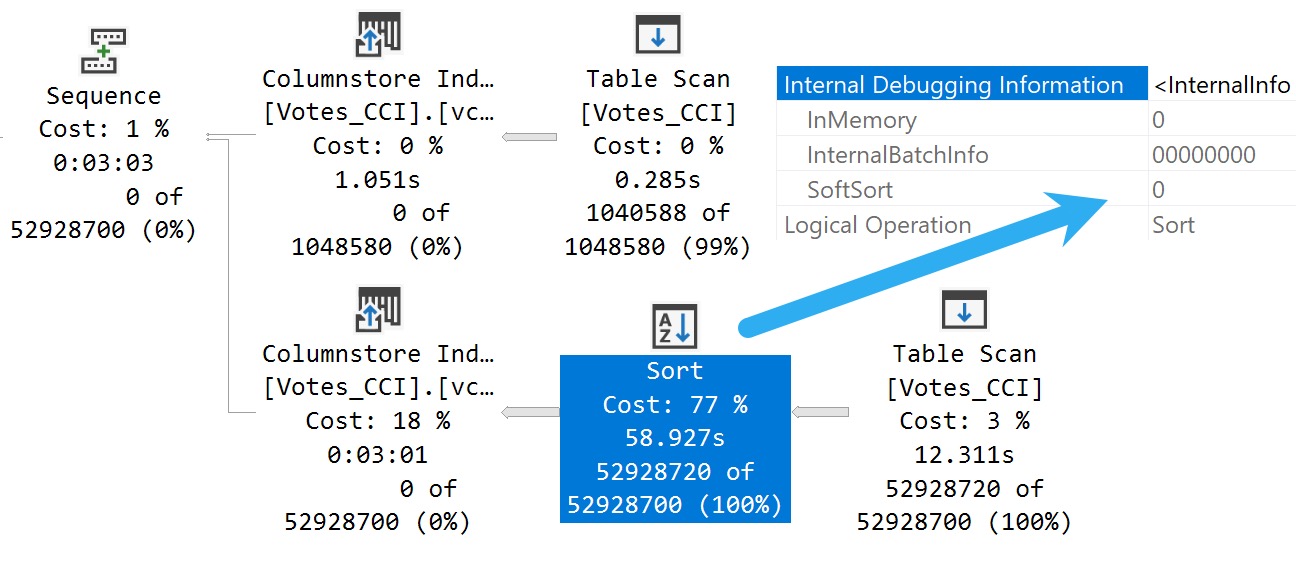
The trace flag below, 2417, is present going back to SQL Server 2014, and can help with the Soft Sort issues we’re seeing when building ordered clustered column store indexes today.
Here’s another one:
DBCC TRACEON(8666, 2417);
CREATE CLUSTERED COLUMNSTORE INDEX
    vcci
ON dbo.Votes_CCI
ORDER (Postid)
WITH(MAXDOP = 1);
DBCC TRACEOFF(8666, 2417);
The MAXDOP 1 hint isn’t strictly necessary. With a parallel plan, you may see up to DOP overlapping row groups.
community service
That’s why it was a popular maneuver to emulate this behavior by creating a clustered row store index, and then create a clustered column store index over it with drop existing and a MAXDOP 1 hint.
At DOP 1, you don’t see that overlap. It takes a lot longer of course — 3 minutes instead of 30 or so seconds — which is a real bummer. But without it, you could see DOP over lapping rowgroups.
If you want All The Pretty Little Rowgroups, this is what you have to do.
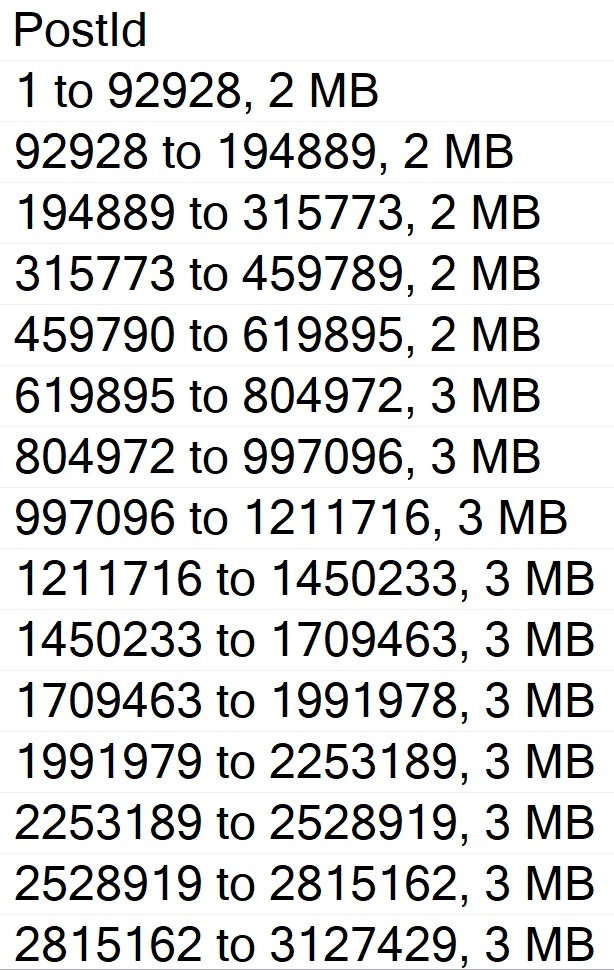
Anyway, the result using sp_BlitzIndex looks a lot better now:
EXEC sp_BlitzIndex
    @TableName = 'Votes_CCI';
capture the flag
How nice.
You can also use undocumented and unsupported trace flag 11621, which is
[A] feature flag for the ‘partition sort on column store order’ so the end result is similar, but via a different mechanism to 2417.
A partition sort is useful in general to prevent unnecessary switching between partitions. If you sort the stream by partition, you process all the rows for one before moving on to the next. A soft sort is ok there because it’s just a performance optimization. Worst case, you end up switching between partitions quite often because the sort ran out of memory, but correct results will still occur.
Chain Gang
A “reasonable” alternative to trace flags maybe to adjust the index create memory configuration option. If we set it down to the minimum value, we get a “helpful” error message:
This index operation requires 123208 KB of memory per DOP.
The total requirement of 985800 KB for DOP of 8 is greater than the sp_configure value of 704 KB set for the advanced server configuration option “index create memory (KB)”.
Increase this setting or reduce DOP and rerun the query.
If you get the actual execution plan for the clustered column store index create or rebuild with the Soft Sort disabled and look at the memory grant, you get a reasonable estimate for what to set index create memory to.
Changing it does two things:
Avoids the very low memory grant that Soft Sorts receive, and causes the uneven row groups
The Soft Sort keeps the index create from going above that index create memory number
Setting index create memory for this particular index creation/rebuild to 5,561,824 gets you the nice, even row groups (at MAXDOP 1) that we saw when disabling the Soft Sort entirely.
Bottom line, here is that uneven row groups happen with column store indexes when there’s a:
Parallel create/rebuild
Low memory grant create/rebuild
If this sort of thing is particularly important to you, you could adjust index create memory to a value that allows the Soft Sort adequate memory.
But that’s a hell of a lot of work, and I hope Microsoft just fixes this in a later build.
The bits for this were technically available in SQL Server 2019 as well, but I’m not telling you how to do that. It’s not supported, and bad things might happen if you use it.
I mean, bad things happen in SQL Server 2022 where it’s supported unless you use an undocumented trace flag, but… Uh. I dunno.
This trace flag seems to set things back to how things worked in the Before Times, though, which is probably how they should have stayed.
Thanks for reading!
Going Further
If this is the kind of SQL Server stuff you love learning about, you’ll love my training. I’m offering a 75% discount to my blog readers if you click from here. I’m also available for consulting if you just don’t have time for that and need to solve performance problems quickly.
There are some code comments you see that really set the stage for how tuning a query is going to go.
Usually one misgiving about how SQL Server works gives way to a whole levee-breaking bevy of other ones and three days later you can’t feel your legs but dammit it’s done.
Okay, maybe it was three hours, but it felt like three days. Something about the gravitation pull of these black hole queries.
One fix I’ve been wishing for, or wish I’ve been fixing for, is a cure for local variables. I’d even be cool if Forced Parameterization was that cure, but you know…
Time will tell.
Husk
Let’s say we’ve got this stored procedure, which does something similar to the “I’m gonna fix parameter sniffing with a local variable hey why is everything around me turning to brimstone before my very eyes?” idea, but with… less of an end-of-times vibe.
CREATE OR ALTER PROCEDURE
    dbo.IndexTuningMaster
(
    @OwnerUserId int,
    @ParentId int,
    @PostTypeId int
)
AS
BEGIN
SET NOCOUNT, XACT_ABORT ON;

    /*Someone passed in bad data and we got a bad query plan,
      and we have to make sure that doesn't happen again*/

    DECLARE
        @ParentIdFix int =
            CASE
                WHEN @ParentId < 0
                THEN 0
                ELSE @ParentId
            END;

    SELECT TOP (1)
        p.*
    FROM dbo.Posts AS p
    WHERE p.ParentId = @ParentIdFix
    AND   p.PostTypeId = @PostTypeId
    AND   p.OwnerUserId = @OwnerUserId
    ORDER BY
        p.Score DESC,
        p.Id DESC;

END;
We get a super low guess for both. obviously that guess hurts a large set of matched data far worse than a small one, but the important thing here is that both queries receive the same bad guess.
This is a direct side effect of the local variable’s poor estimate, which PSP isn’t quite yet ready to go up against.
Thanks for reading!
Going Further
If this is the kind of SQL Server stuff you love learning about, you’ll love my training. I’m offering a 75% discount to my blog readers if you click from here. I’m also available for consulting if you just don’t have time for that and need to solve performance problems quickly.
While the Parameter Sensitive Plan (PSP) optimization won’t fix every problem with this lazy coding habit, it can fix some of them in very specific circumstances, assuming:
The parameter is eligible for PSP
The parameter is present across IF branches
We’re going to use a simple one parameter example to illustrate the potential utility here.
After all, if I make these things too complicated, someone might leave a comment question.
The horror
IFTTT
Here’s the procedure we’re using. The point is to execute one branch if @Reputation parameter is equal to one, and another branch if it equals something else.
In the bad old days, both queries would get a plan optimized at compile time, and neither one would get the performance boost that you hoped for.
In the good news days that you’ll probably get to experience around 2025, things are different!
CREATE OR ALTER PROCEDURE
    dbo.IFTTT
(
    @Reputation int
)
AS
BEGIN
SET NOCOUNT, XACT_ABORT ON;

SET STATISTICS XML ON;

    IF @Reputation = 1
    BEGIN
        SELECT
            u.Id,
            u.DisplayName,
            u.Reputation,
            u.CreationDate
        FROM dbo.Users AS u
        WHERE u.Reputation = @Reputation;
    END;

    IF @Reputation > 1
    BEGIN
        SELECT
            u.Id,
            u.DisplayName,
            u.Reputation,
            u.CreationDate
        FROM dbo.Users AS u
        WHERE u.Reputation = @Reputation;
    END;

SET STATISTICS XML OFF;

END;
GO
Johnson & Johnson
If we execute these queries back to back, each one gets a new plan:
EXEC dbo.IFTTT
    @Reputation = 1;
GO

EXEC dbo.IFTTT
    @Reputation = 2;
GO
psychic driving
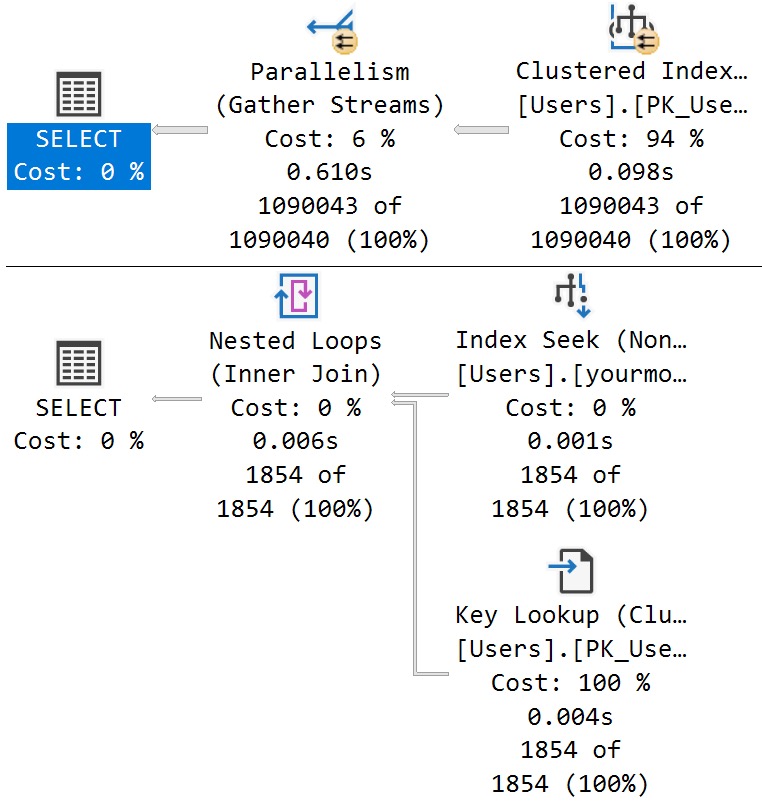
Optimize For You
The reason why is in the resulting queries, as usual. The Reputation column has enough skew present to trigger the PSP optimization, so executions with differently-bucketed parameter values end up with different plans.
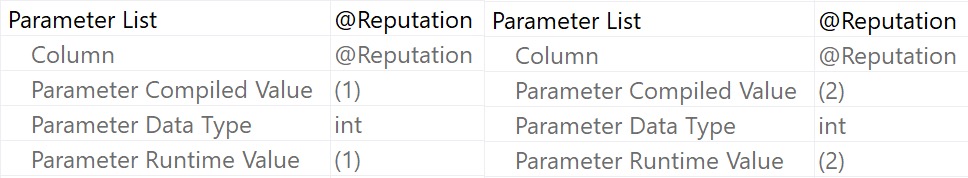
And of course, each plan has different compile and runtime values:
care
If I were to run this demo in a compatibility level under 160, this would all look totally different.
This is one change I’m sort of interested to see the play-out on.
Thanks for reading!
Going Further
If this is the kind of SQL Server stuff you love learning about, you’ll love my training. I’m offering a 75% discount to my blog readers if you click from here. I’m also available for consulting if you just don’t have time for that and need to solve performance problems quickly.
After seeing places where the Parameter Sensitive Plan (PSP) optimization quite stubbornly refuses to kick in, it’s somewhat amusing to see it kick in where it can’t possibly have any positive impact.
Even though some parameters are responsible for filtering on columns with highly skewed data, certain other factors may be present that don’t allow for the type of plan quality issues you might run into under normal parameter sensitivity scenarios:
Adequate indexing
Row goals
Other filtering elements
This isn’t to say that they can always prevent problems, but they certainly tend to reduce risks much of the time.
If only everything were always ever perfect, you know?
Setup
Let’s start by examining some data in the Posts table.
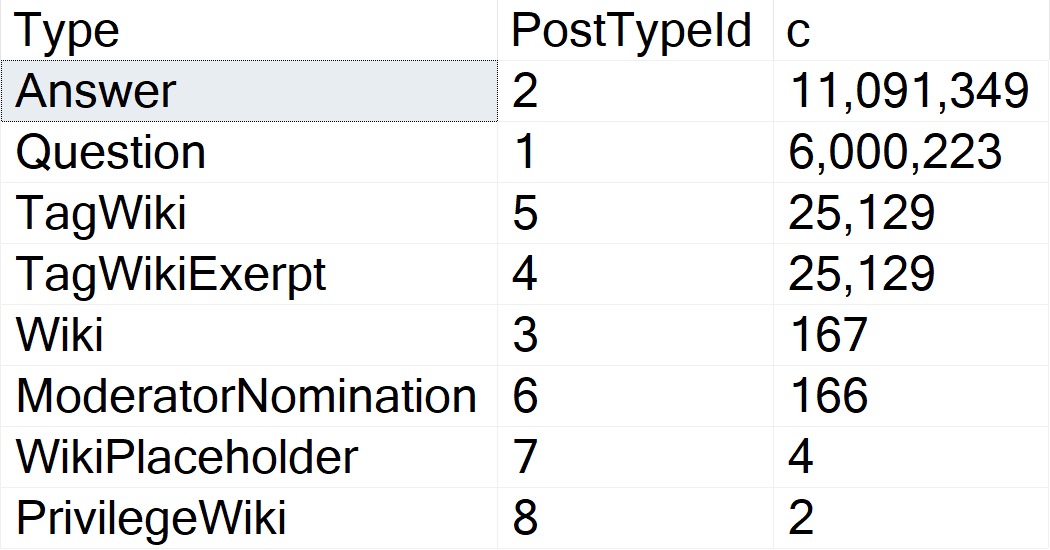
First, PostTypeIds:
resultant
Questions and answers are the main types of Posts. The data is clearly skewed, here, and in my testing this does qualify for PSP on its own.
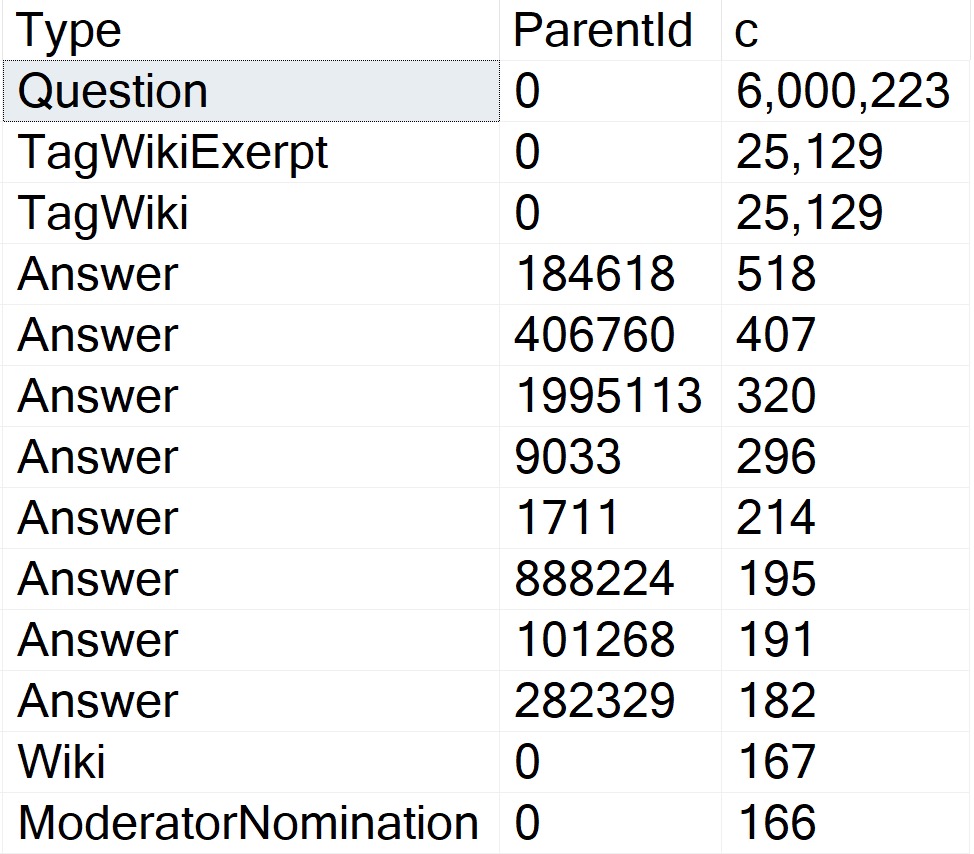
The thing is, there are several attributes that Questions can have that Answers can’t. One of those is a ParentId. Looking through how the top 15 or so of those counts breaks down:
hitherto
Okay, so! Wikis don’t have ParentIds, neither do Moderator Nominations. More importantly, Questions don’t.
The Question with the Most answers is Id 184618, with 518. A far cry from the next-nearest Post Types, and light years from the number of Questions with a ParentId of zero.
More important than loving your data is knowing your data.
To Query A Butterfly
Let’s say we have this query:
SELECT TOP (5000)
    p.Id,
    p.OwnerUserId,
    p.Score
FROM dbo.Posts AS p
WHERE p.PostTypeId = @po
AND   p.ParentId = @pa
ORDER BY
    p.Score DESC;
The three things we care about getting done are:
Filtering to PostTypeId
Filtering to ParentId
Ordering by Score
Either of these indexes would be suitable for that:
CREATE INDEX
    popa
ON dbo.Posts
(
    PostTypeId,
    ParentId,
    Score DESC
)
WITH
(
    SORT_IN_TEMPDB = ON,
    DATA_COMPRESSION = PAGE
);

CREATE INDEX
    papo
ON dbo.Posts
(
    ParentId,
    PostTypeId,
    Score DESC
)
WITH
(
    SORT_IN_TEMPDB = ON,
    DATA_COMPRESSION = PAGE
);
With No PSP At All
Under compatibility level 150, we can run the query in a variety of ways and get nearly identical performance results:
There’s a 27 millisecond difference between the two to find the first 5000 rows that match both predicates. You would have to run these in a very long loop to accumulate a meaningful overall difference.
In this case, both queries use and reuse the same execution plan. You can see that in the estimates.
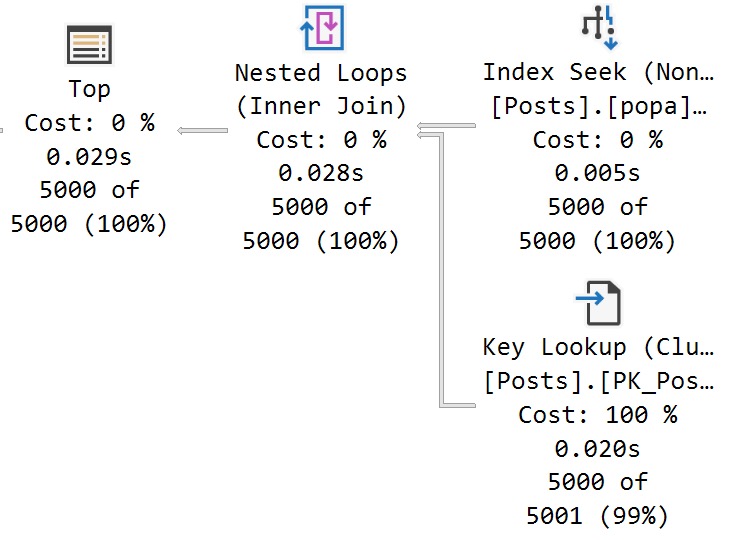
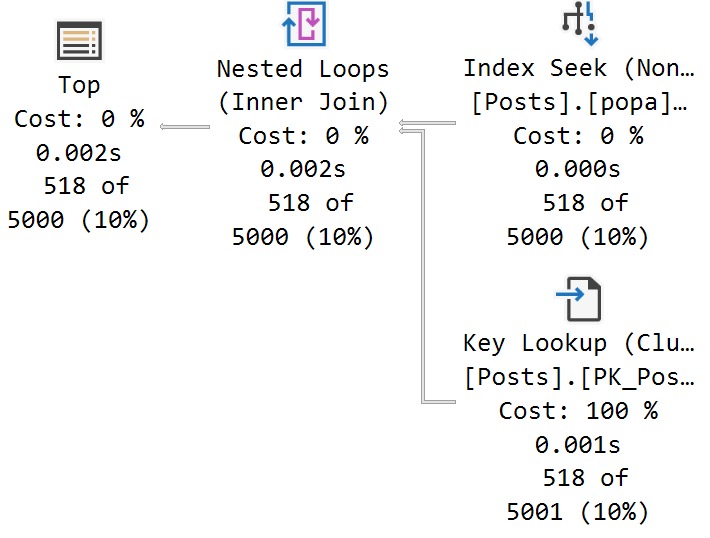
With All The PSP
Switching to compat level 160, the queries are injected with the PLAN PER VALUE hint.
SELECT TOP (5000)
    p.Id,
    p.OwnerUserId,
    p.Score
FROM dbo.Posts AS p
WHERE p.PostTypeId = @po
AND   p.ParentId = @pa
ORDER BY
    p.Score DESC
OPTION
(
    PLAN PER VALUE
    (
        QueryVariantID = 2,
        predicate_range
        (
            [StackOverflow2013].[dbo].[Posts].[PostTypeId] = @po,
            100.0,
            10000000.0
        )
    )
)

SELECT TOP (5000)
    p.Id,
    p.OwnerUserId,
    p.Score
FROM dbo.Posts AS p
WHERE p.PostTypeId = @po
AND   p.ParentId = @pa
ORDER BY
    p.Score DESC
OPTION
(
    PLAN PER VALUE
    (
        QueryVariantID = 3,
        predicate_range
        (
            [StackOverflow2013].[dbo].[Posts].[PostTypeId] = @po,
            100.0,
            10000000.0
        )
    )
)
The thing is, both queries end up with identical execution times to when there was no PSP involved at all.
In other words, there is no parameter sensitivity in this scenario, despite there being skew in the column data.
Even searching for the “big” result — Questions with a ParentId of zero, finishes in <30 milliseconds.
Ah well. Gotta train the models somehow.
Thanks for reading!
Going Further
If this is the kind of SQL Server stuff you love learning about, you’ll love my training. I’m offering a 75% discount to my blog readers if you click from here. I’m also available for consulting if you just don’t have time for that and need to solve performance problems quickly.
When I talk to clients about using dynamic SQL, they’re usually under the misconception that those plans can’t get reused.
That may be true under some circumstances when:
It’s not properly parameterized
You use EXEC only and not sp_executesql
Under more favorable circumstances, dynamic SQL gets run, executed, and plans cached and reused with the same frequency as stored procedures.
Now, dynamic SQL isn’t exactly the same as stored procedures. There’s a lot you can do with those that just looks a mess in dynamic SQL, especially longer bits of code.
In today’s post, we’re going to look at how the Parameter Sensitive Plan (PSP) optimization works with dynamic SQL.
Bright, Sunshiny
I just learned how to spell “sunshiny”. Don’t let anyone ever tell you there’s nothing left to learn.
To keep up the sunshiny visage of today’s post, let’s get a TL;DR here: PSP does work with parameterized dynamic SQL.
Here’s an example, using a query with a parameter eligible for the PSP optimization.
DECLARE
    @sql nvarchar(MAX) =
        N'',
    @parameters nvarchar(MAX) =
        N'@ParentId int';

SELECT
    @sql += N'
SELECT
    c = COUNT_BIG(*)
FROM dbo.Posts AS p
WHERE p.ParentId = @ParentId;
';

EXEC sys.sp_executesql
    @sql,
    @parameters,
    0;

EXEC sys.sp_executesql
    @sql,
    @parameters,
    184618;
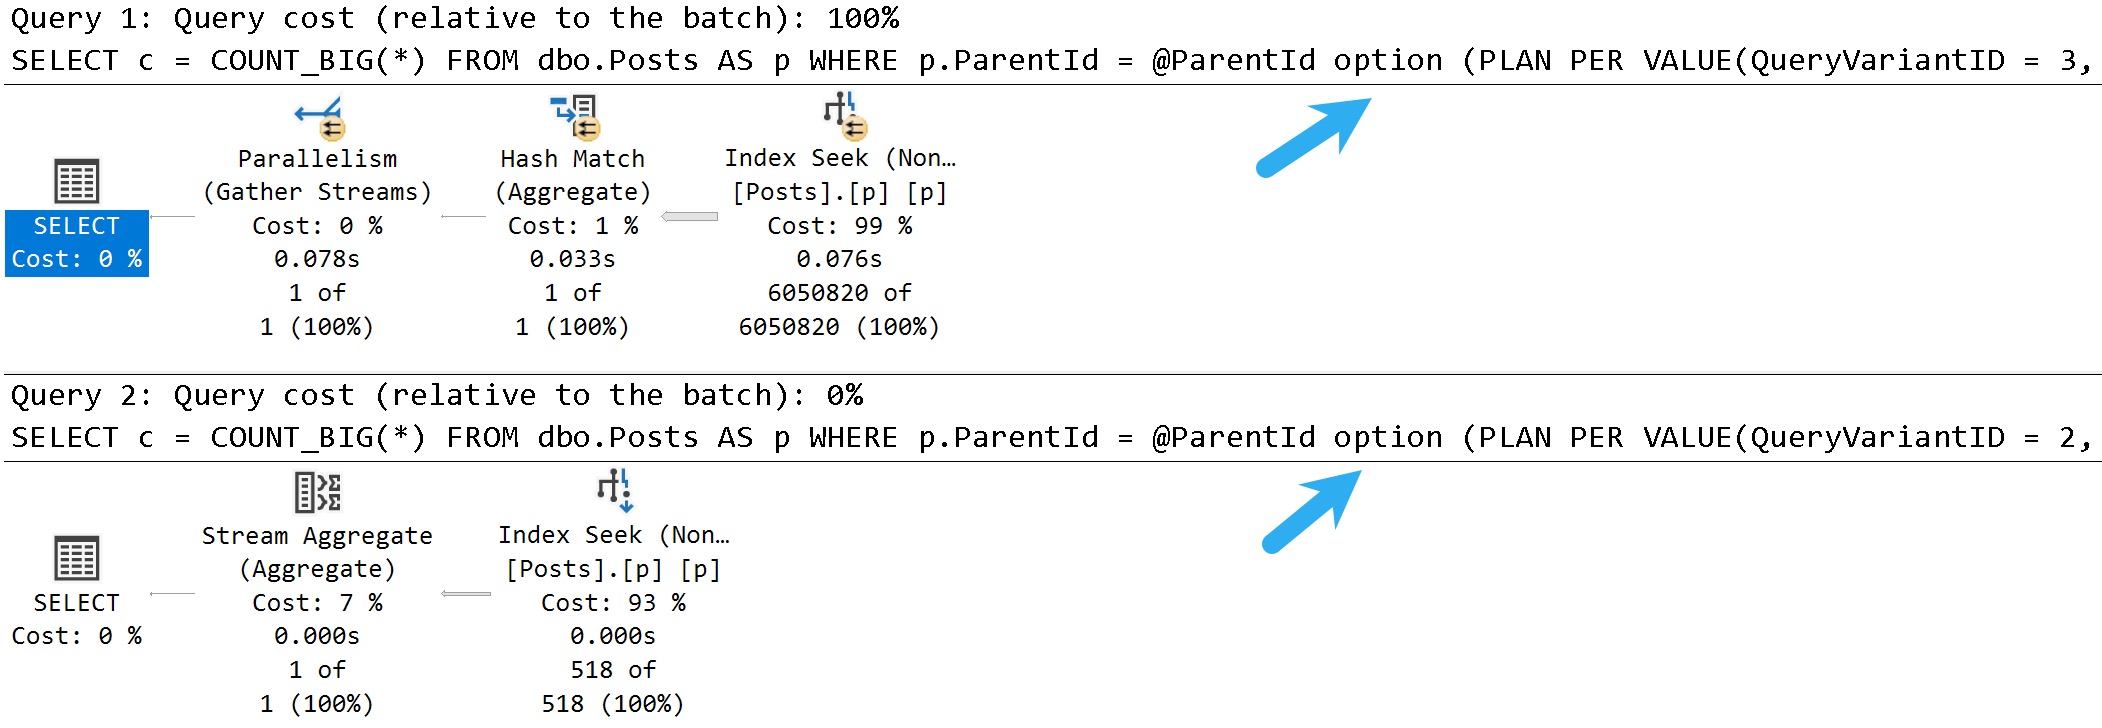
Both executions here get the option(plan per value... text at the end that indicates PSP kicked in, along with different query plans as expected.
end of time
Being Dense
Writing the not-good kind of dynamic SQL, like so:
SELECT
    @sql = N'
SELECT
    c = COUNT_BIG(*)
FROM dbo.Posts AS p
WHERE p.ParentId = ' + CONVERT(nvarchar(11), 0) + ';';
You will of course get different execution plans, but you’ll get a new execution plan for every different value that gets passed in. You will not get the PSP optimization.
This is not a good example of how you should be writing dynamic SQL. Please don’t do this, unless you have a good reason for it.
Anyway, this is good news, especially for parameterized ORM queries that currently plague many systems in crisis that I get to see every week.
Fun.
Thanks for reading!
Going Further
If this is the kind of SQL Server stuff you love learning about, you’ll love my training. I’m offering a 75% discount to my blog readers if you click from here. I’m also available for consulting if you just don’t have time for that and need to solve performance problems quickly.
The index and proc creation script for this are a bit on the long side, so I’m going to stick them in a GitHub gist to keep the post concise, since we have some other ground to cover here.
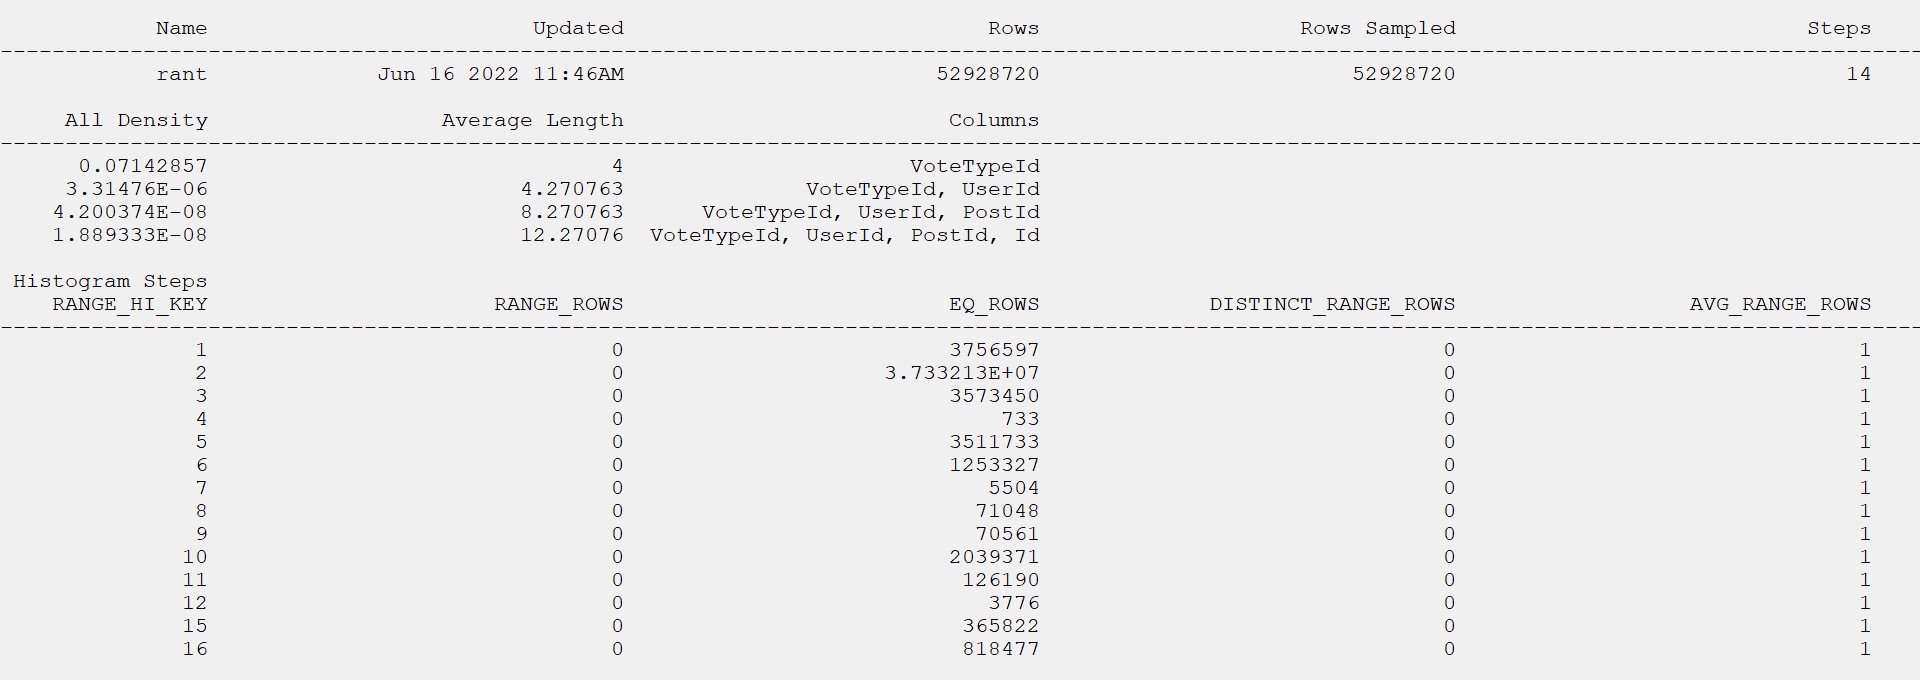
I want to lead with the statistics object that gets used for the query, which has a single equality predicate on the parameter value to search the VoteTypeId column.
The relevant portion of the query is this:
FROM     dbo.Votes AS v
WHERE    v.VoteTypeId = @VoteTypeId
The histogram matches the row counts from the table precisely. Thanks, full scan!
So, what’s the problem?
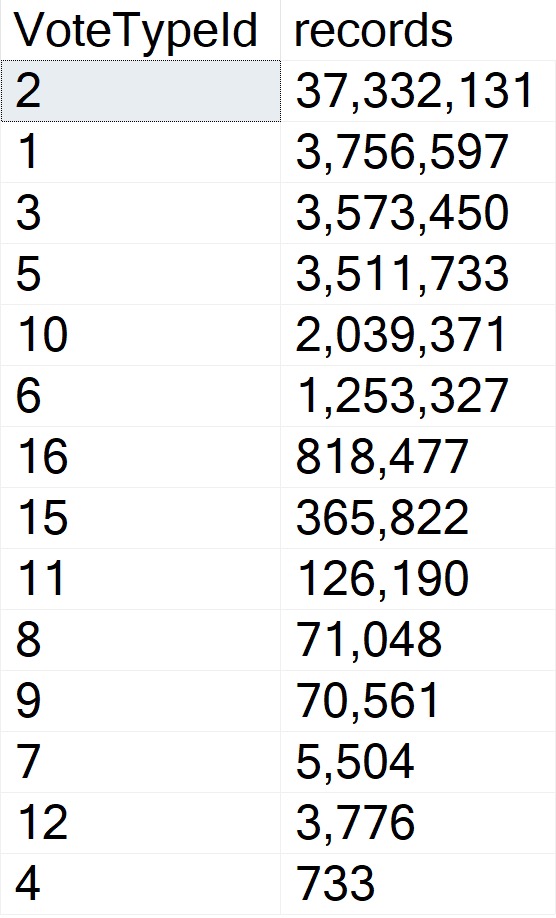
Autoproblematic
To my eye, there’s sufficient skewness here to present parameter sensitivity issues.
skewdriver
But SQL Server disagrees!
ouch dude
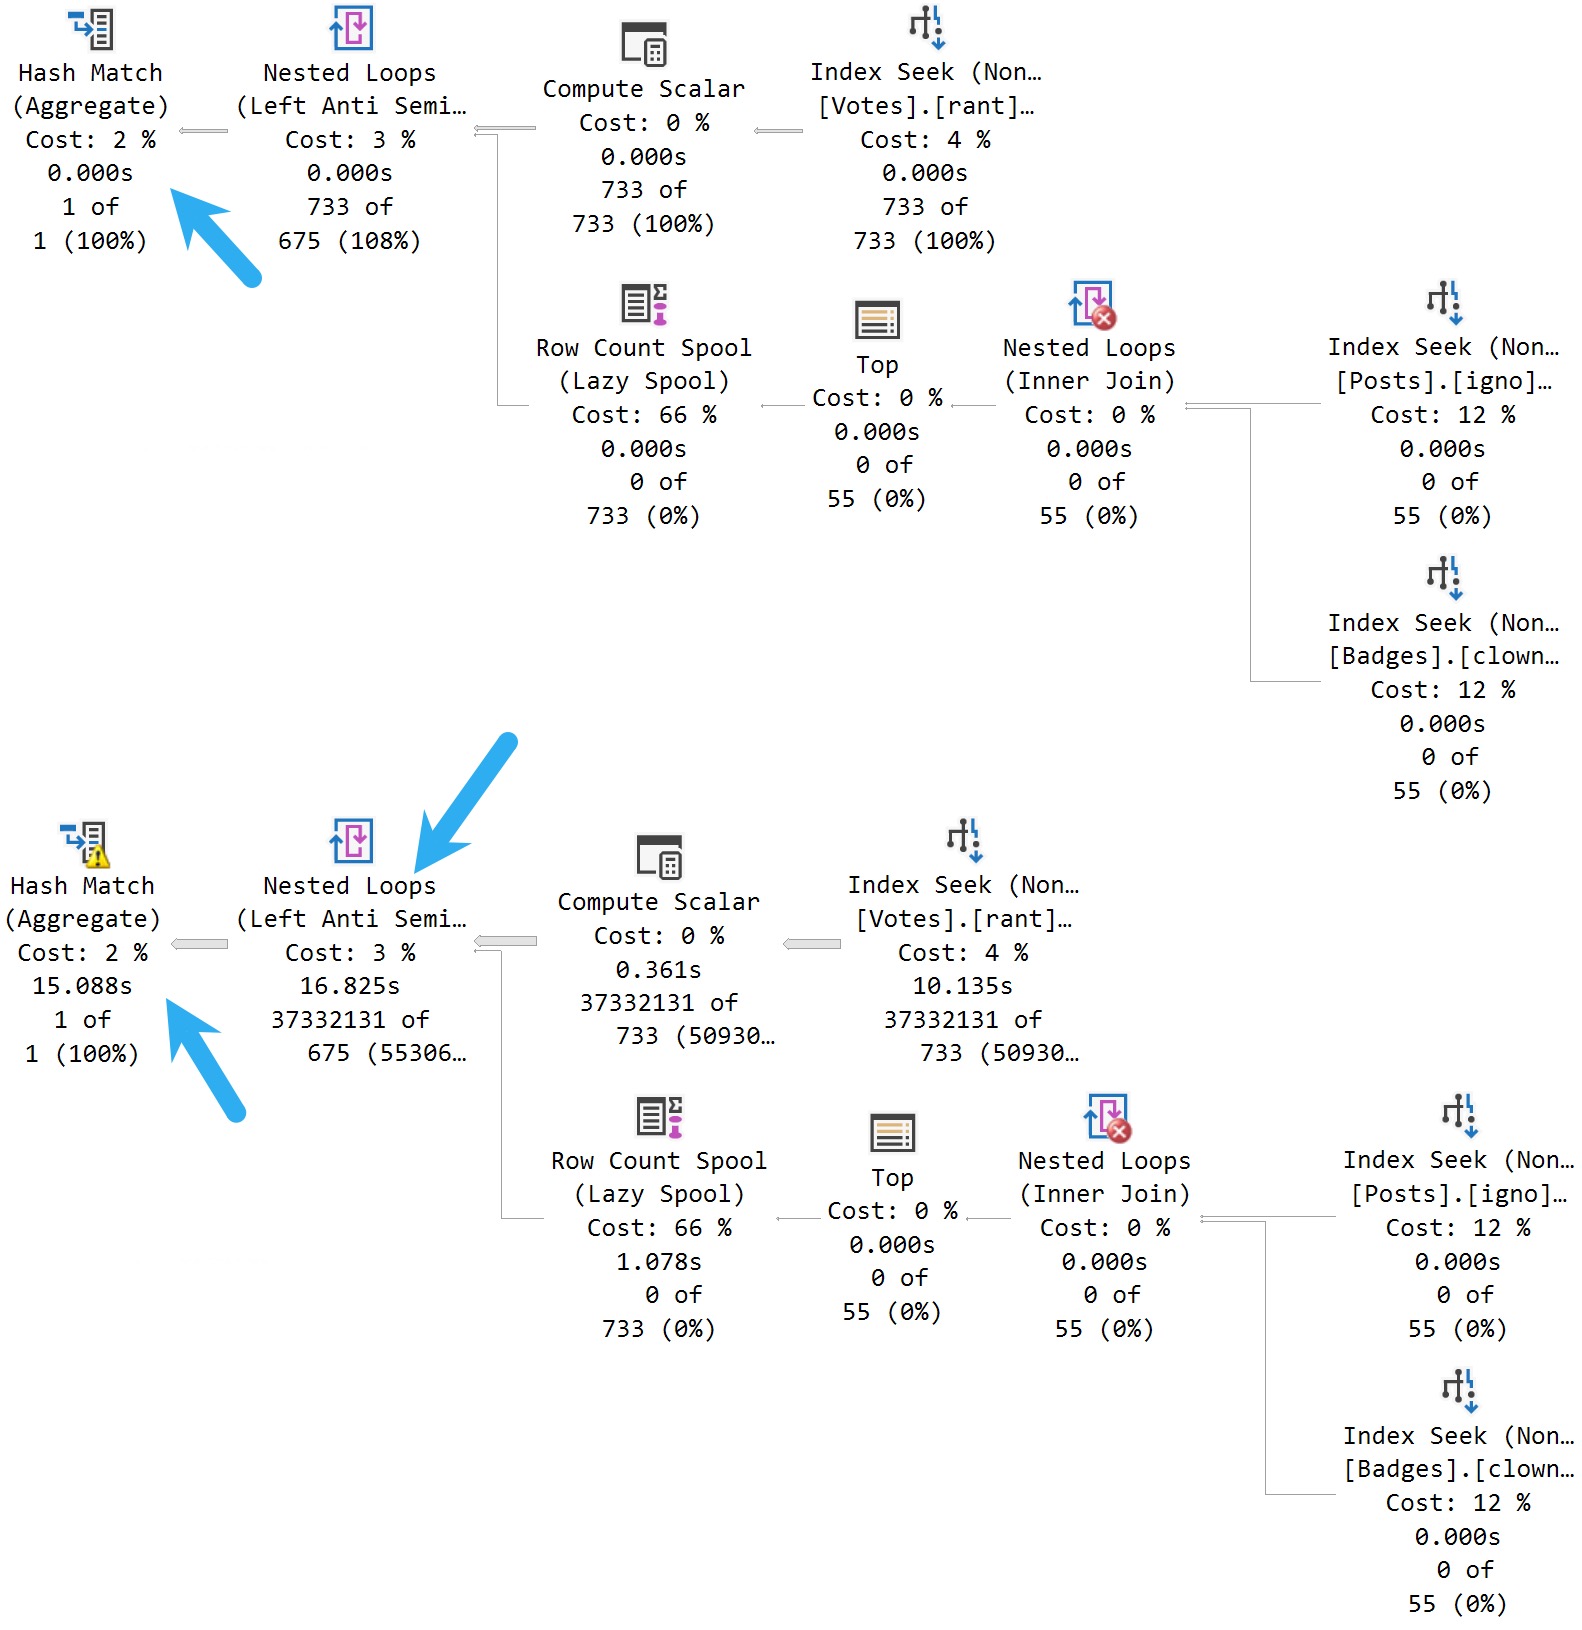
733 records vs. 37 million records seems appropriately skewed to me, but we get all of the typical parameter sensitivity symptoms.
Take a moment here to admire the somewhat confusing plan timing that Batch Mode operations are presenting here: The bottom query runs for around 32 seconds.
Up to the Nested Loops join, we use ~17 seconds of wall clock time with our serial execution plan. The Hash Match operator runs for 15 seconds on its own, in Batch Mode.
Parameter sensitivity still happens in SQL Server 2022.
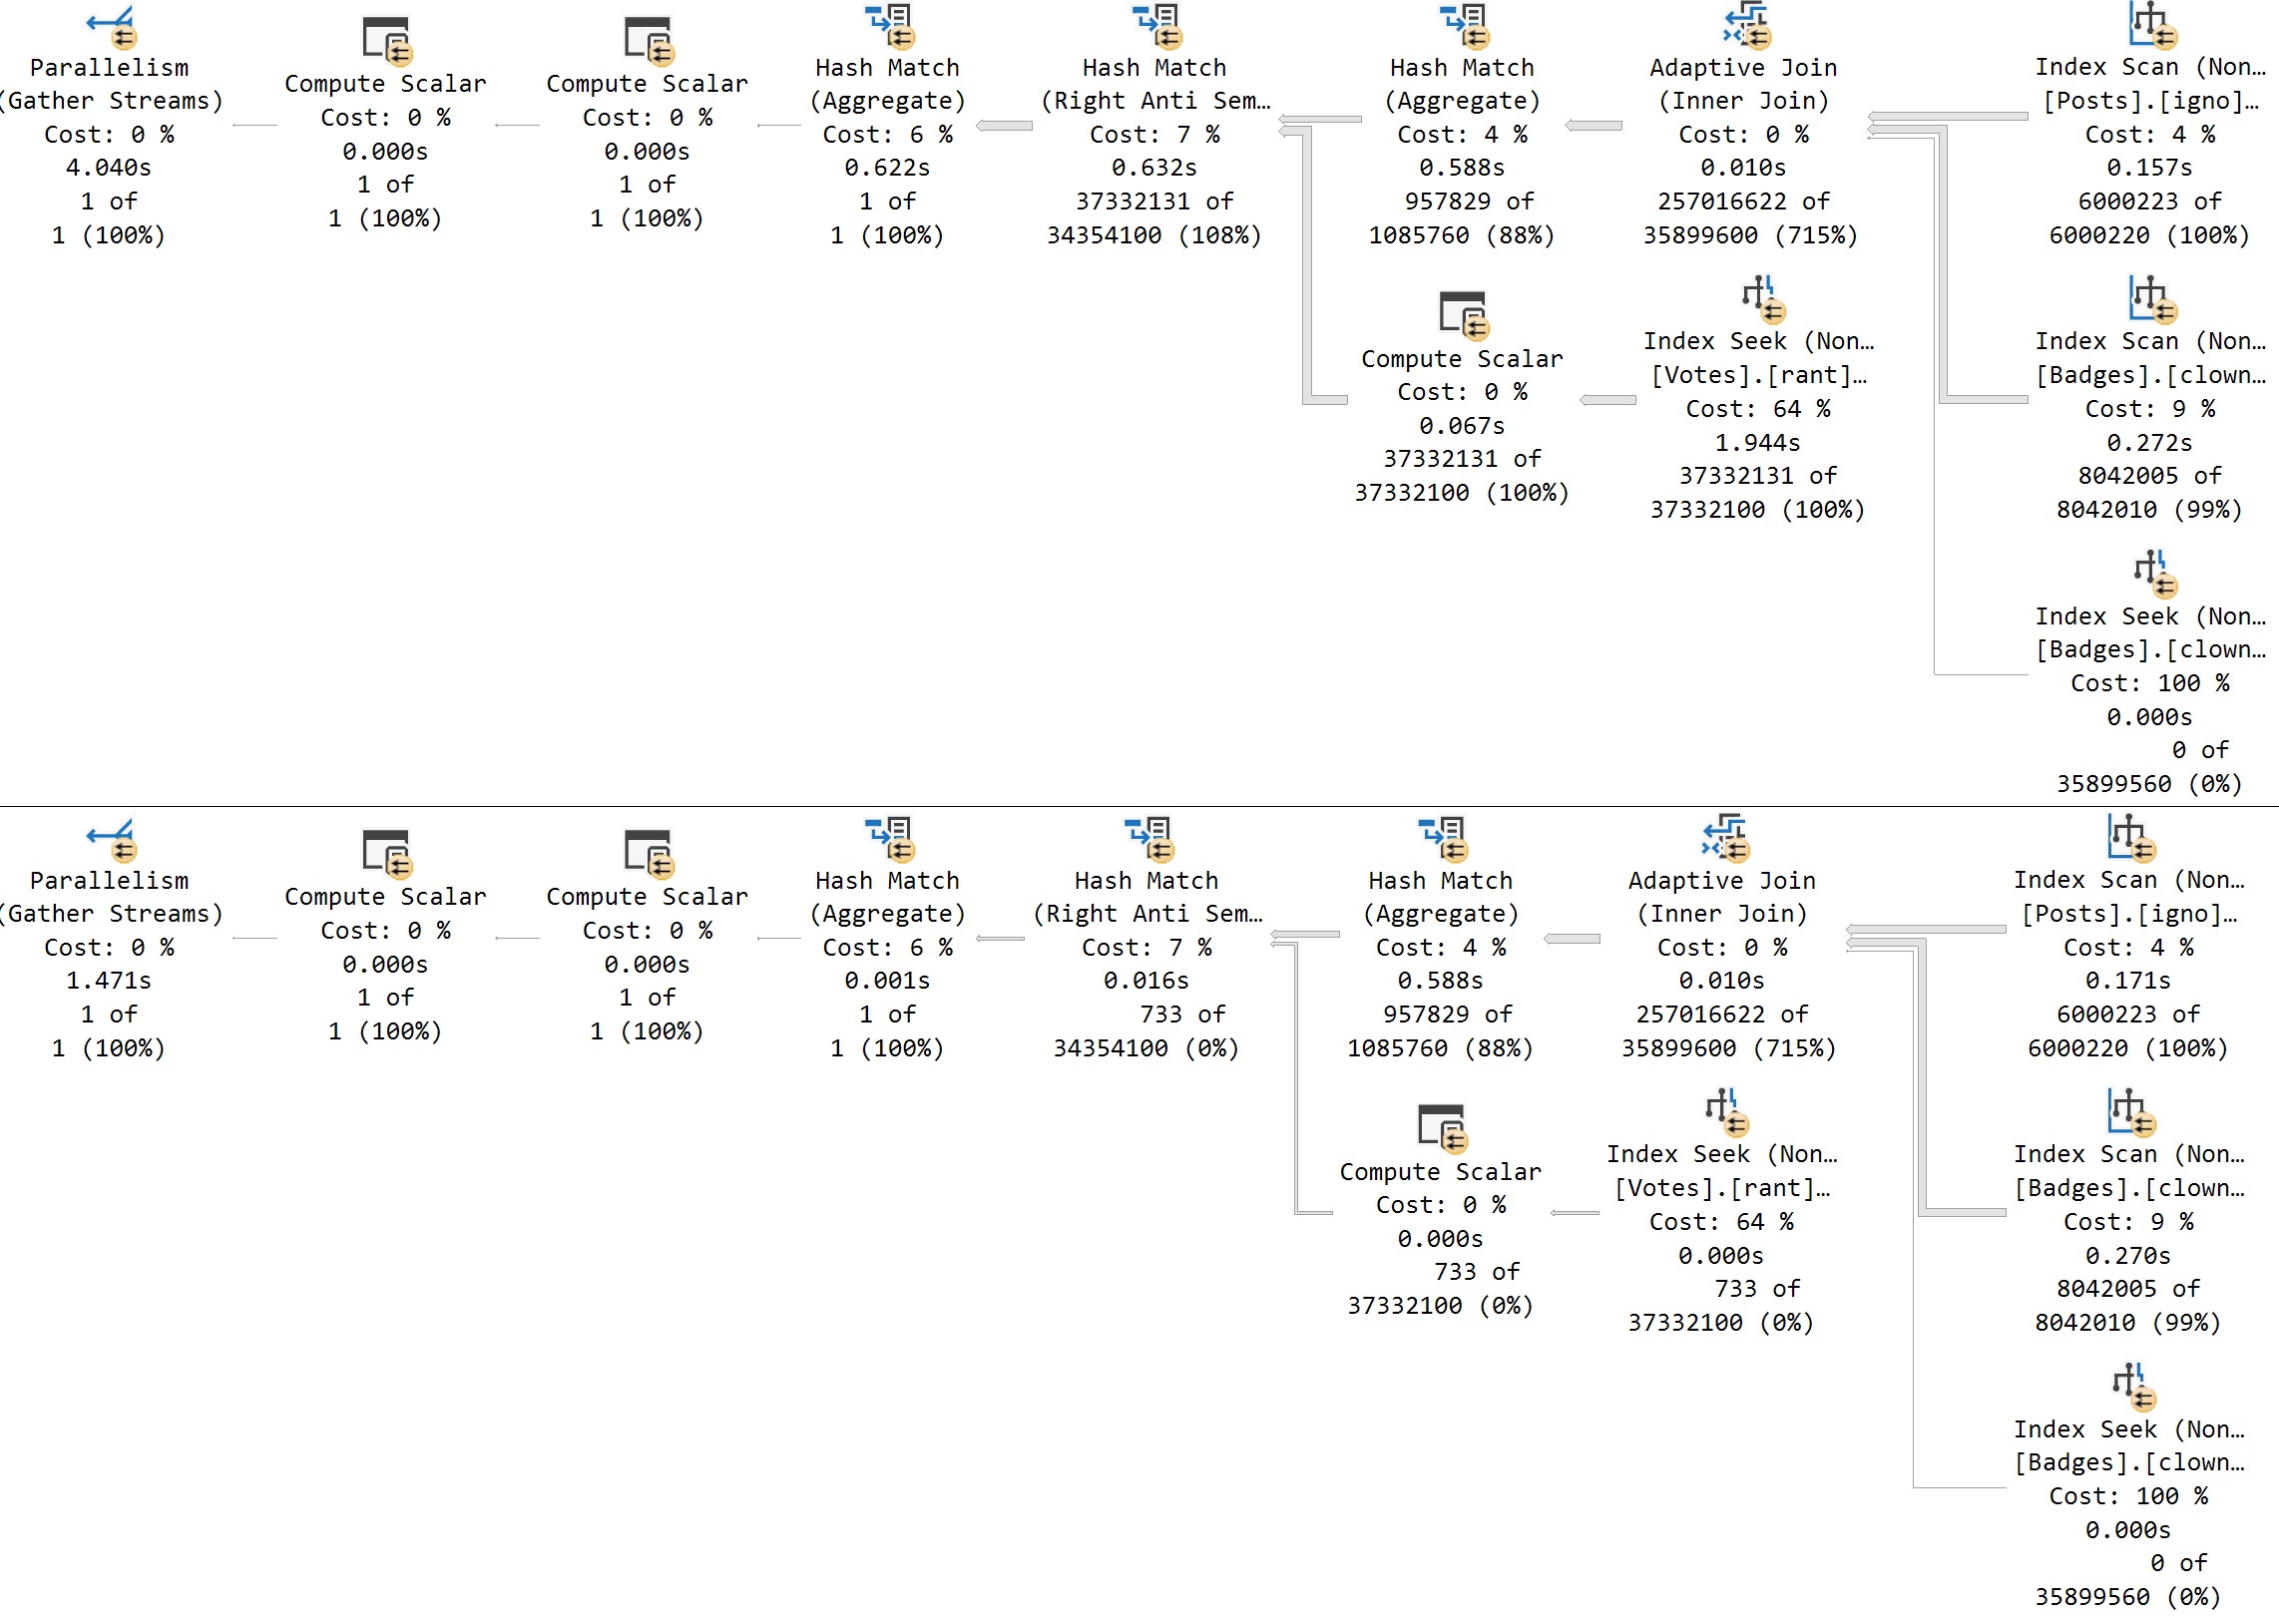
Reversi
If we run the procedure in reverse order, using 4 to cache the plan and then 2 to reuse, we get a similar regression:
little things
Now, okay, let’s pause for a minute here. I need to backtrack, but I don’t want to spend a ton of blogspace on it. I’m also going to put the information in a very snooty block quote.
If we re-run the procedure from the section up above to search for VoteTypeId 2 a second time, Memory Grant Feedback will fix the spill at the Hash Join, and bring the total execution time down to about 15 seconds.
That is an improvement, but… Look at the plan here. If VoteTypeId 2 uses a plan more suited to the number of rows it has to process, the overall time is around 4 seconds, with no need for a memory grant correction.
The second plan for this execution sequence, searching for VoteTypeId 4 second in order, the overall time goes from 0 seconds and 0 milliseconds to 1.4 seconds. The big plan does not make searching for infrequent values faster.
So you see, the big plan isn’t always better.
Missed Connections
Hey, look, this is the first CTP. Maybe stuff like this is still getting ironed out. Maybe this blog post will change the course of history.
I am only moderately influential in the eyes of Microsoft, though, so perhaps not.
Anyway, this seems like a situation with sufficient skew to produce the Dispatcher plan and then additional sub-plans to account for far different row counts present in the VoteTypeId column.
If this scenario (and other similar scenarios) is outside the scope of the feature, query tuning folks are still going to have a whole lot of parameter sensitivity issues to deal with.
And should that be the case, I’d like to speak to the manager.
Thanks for reading!
Going Further
If this is the kind of SQL Server stuff you love learning about, you’ll love my training. I’m offering a 75% discount to my blog readers if you click from here. I’m also available for consulting if you just don’t have time for that and need to solve performance problems quickly.
Let’s take a brief moment to talk about terminology here, so you don’t go getting yourself all tied up in knots:
Parameter Sniffing: When the optimizer creates and caches a plan based on a set of parameter(s) for reuse
Parameter Sensitivity: When a cached plan for one set of parameter(s) is not a good plan for other sets of parameter(s)
The first one is a usually-good thing, because your SQL Server won’t spend a lot of time compiling plans constantly. This is obviously more important for OLTP workloads than for data warehouses.
This can pose problems in either type of environment when data is skewed towards one or more values, because queries that need to process a lot of rows typically need a different execution plan strategy than queries processing a small number of rows.
This seems a good fit for the Intelligent Query Processing family of SQL Server features, because fixing it sometimes requires a certain level of dynamism.
Choice 2 Choice
The reason this sort of thing can happen often comes down to indexing. That’s obviously not the only thing. Even a perfect index won’t make nested loops more efficient than a hash join (and vice versa) under the right circumstances.
Probably the most classic parameter sensitivity issue, and why folks spend a long time trying to fix them, is the also-much-maligned Lookup.
But consider the many other things that might happen in a query plan that will hamper performance.
Join type
Join order
Memory grants
Parallelism
Aggregate type
Sort/Sort Placement
Batch Mode
The mind boggles at all the possibilities. This doesn’t even get into all the wacky and wild things that can mess SQL Server’s cost-based optimizer up a long the way.
With SQL Server 2022, we’ve finally got a starting point for resolving this issue.
In tomorrow’s post, we’ll talk a bit about how this new feature works to help with your parameter sensitivity issues, which are issues.
Not your parameter sniffing issues, which are not issues.
For the rest of the week, I’m going to dig deeper into some of the stuff that the documentation glosses over, where it helps, and show you a situation where it should kick in and help but doesn’t.
Keep in mind that these are early thoughts, and I expect things to evolve both as RTM season approaches, and as Cumulative Updates are released for SQL Server 2022.
Remember scalar UDF inlining? That thing morphed quite a bit.
Can’t wait for all of you to get on SQL Server 2019 and experience it.
Thanks for reading!
Going Further
If this is the kind of SQL Server stuff you love learning about, you’ll love my training. I’m offering a 75% discount to my blog readers if you click from here. I’m also available for consulting if you just don’t have time for that and need to solve performance problems quickly.
If you’re ever on a long flight and want something to fall asleep to, ask a DBA how to set MAXDOP.
Sometimes I even ask myself that question when I’m tossing and turning at night.
There are a lot of things to consider when fixing settings globally across a workload. For parallelism, it’s less about individual query performance, and more about overall server/workload performance
After all, letting every query go as absolutely parallel as possible is only good up to a point; that point is usually when you start regularly running out of worker threads, or your CPUs could double as crematoriums.
Setting MAXDOP is about limiting the damage that a parallel workload can do to a server. The expectation is that a query running at DOP 8 will run 8x faster than a query running at DOP 1.
But setting MAXDOP for every query isn’t something you catch even the most persnickety performance tuners doing. Perhaps some of the more critical ones, but you know…
Let Me Rust
I’m not going to demo DOP feedback in this post, I’m just going to show you the situation that it hopes to improve upon.
To do that, I’m going to run a simple aggregation query at different degrees of parallelism, and show you the changes in query timing.
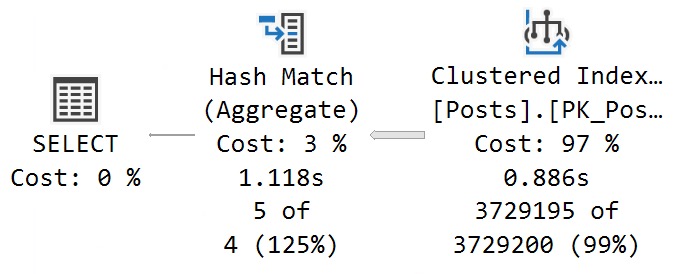
At DOP 1:
The query runs for 1.1 seconds, with 886ms consumed while scanning the Posts table.
DOPPER DON
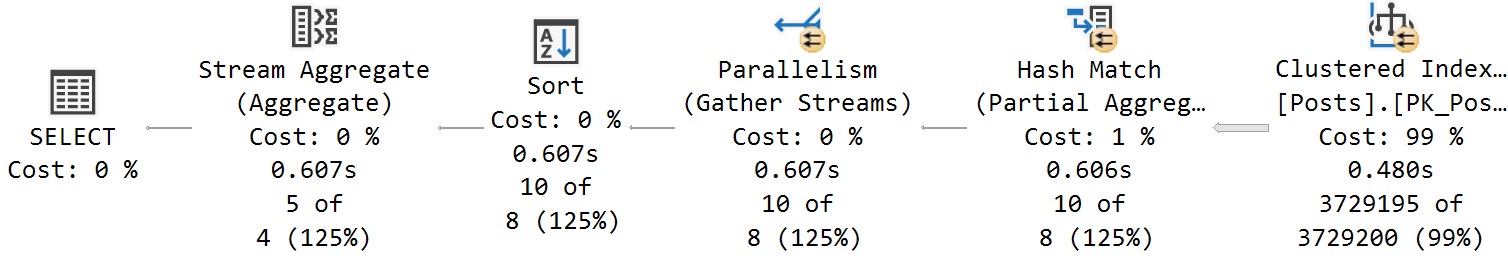
At DOP 2:
The query runs just about twice as fast, starting with the scan of the Posts table taking about half as long. This is good scaling. Add one CPU, go twice as fast as you did with one CPU.
Rip Van Winkle
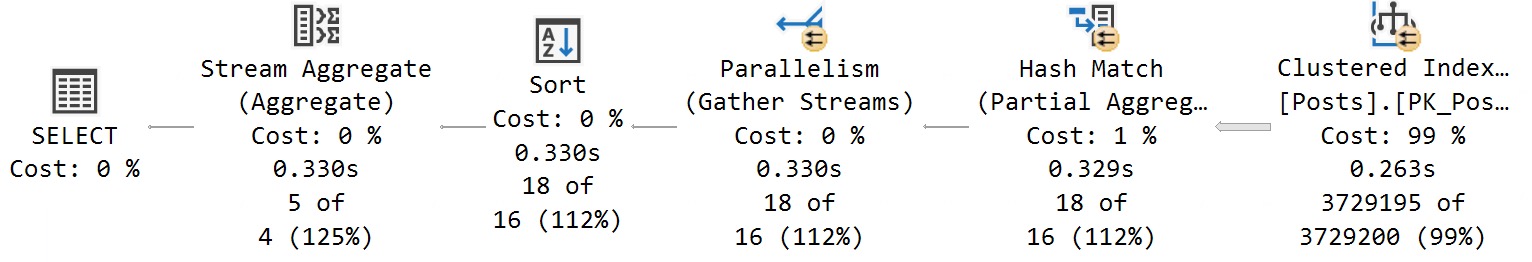
At DOP 4:
The gets about twice as fast again! The scan of the Posts table is now down to 263ms, and the query in total is at 330ms. Adding in two more cores seems a good choice, here.
Bed Rock
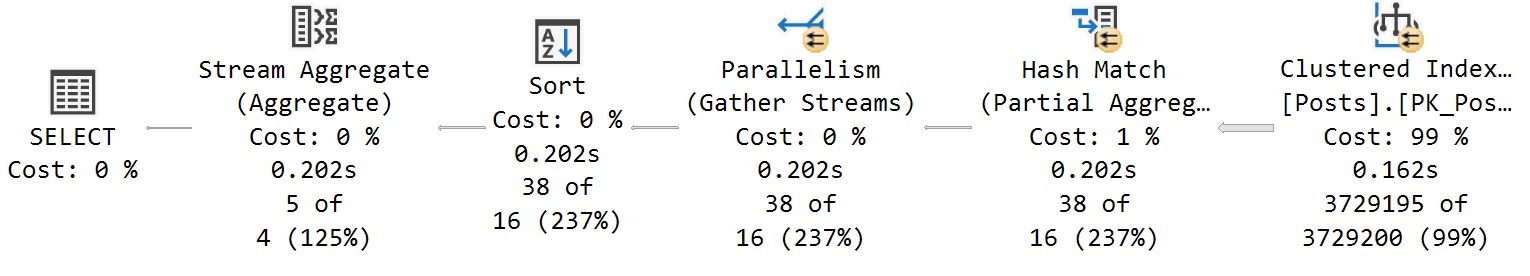
At DOP 8:
The query no longer continues to get 2x faster. This isn’t a knock against DOP 8 in general; my query just happens to hit a wall around DOP 4. With 4 additional CPUs, we only save ~130ms at the end of the day.
Anubis
Why This Is Cool
This new feature will help DBAs have to worry less about getting MAXDOP absolutely right across the board. Who knows, we may even see a day where MAXDOP is left at zero.
But you’d never skip that installer step, would you?
Anyway, for anyone out there who is paranoid about setting DOP too high, this should help your queries find a more approximately-good middle ground.
Hopefully it works as advertised.
Thanks for reading!
Going Further
If this is the kind of SQL Server stuff you love learning about, you’ll love my training. I’m offering a 75% discount to my blog readers if you click from here. I’m also available for consulting if you just don’t have time for that and need to solve performance problems quickly.
SQL Server query plans have had, forever, pretty generic reasons embedded in the XML for why your query was prevented from going parallel.
Not for things like it not breaking the Cost Threshold For Parallelism barrier, which should be obvious to the end user, but certainly for things like scalar UDFs, etc.
The thing is, the reason always seemed to be “Could Not Generate Valid Parallel Plan” for most of them, even though more explicit reasons were available.
They started cropping up, as things do, in Azure SQL DB, and have finally made it to the box product that we all know and mostly love.
Let’s explore some of them! Because that’s what we do.
Generate Valid Blog Post
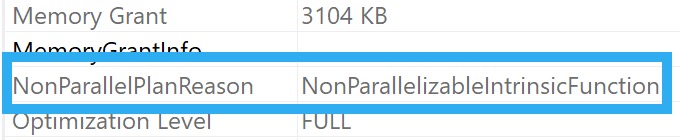
First, some intrinsic functions prevent a parallel plan. You can always see the reason (if one exists) if you look in the properties of the root operator in the query plan.
not for you!
Some Intrinsic Functions
An easy one to validate this with is OBJECT_NAME
SELECT
    c = OBJECT_NAME(COUNT_BIG(*))
FROM dbo.Posts AS p;
There’s always some hijinks about with cursors, but here you go:
DECLARE
    @c bigint;

DECLARE
    c CURSOR
    FAST_FORWARD
FOR
SELECT
    c = COUNT_BIG(*)
FROM dbo.Posts AS p;

OPEN c;

FETCH NEXT
FROM
    c
INTO
    @c;

CLOSE c;
DEALLOCATE c;
GO
This is another reason that I have seen around for a while too, but we may as well be thorough:
CREATE OR ALTER FUNCTION
    dbo.c
(
    @c bigint
)
RETURNS bigint
WITH SCHEMABINDING, RETURNS NULL ON NULL INPUT
AS
BEGIN
    DECLARE /*Ruin UDF inlining with one weird trick*/
        @gd datetime = GETDATE();
    RETURN @c;
END;
GO

SELECT
    c = dbo.c(COUNT_BIG(*))
FROM dbo.Posts AS p;
Fun stuff is always in XML. Just think about all the best times in your life. I bet XML was involved.
Now when you look at it, it will tell you what’s screwing up parallel plan generation in your SQL Server queries.
J’accuse, as they say.
Thanks for reading!
Going Further
If this is the kind of SQL Server stuff you love learning about, you’ll love my training. I’m offering a 75% discount to my blog readers if you click from here. I’m also available for consulting if you just don’t have time for that and need to solve performance problems quickly.