To get you started exploring the Stack Overflow column store database, here are some queries that show how tables are related.
The two main relationships are User Id, and Post Id.
User Id
/*User Id*/
SELECT COUNT_BIG(*) AS records
FROM dbo.Users AS u
JOIN dbo.Badges AS b
    ON b.UserId = u.Id;

SELECT COUNT_BIG(*) AS records
FROM dbo.Users AS u
JOIN dbo.Comments AS c
    ON c.UserId = u.Id;

SELECT COUNT_BIG(*) AS records
FROM dbo.Users AS u
JOIN dbo.Posts AS p
    ON p.OwnerUserId = u.Id;

SELECT COUNT_BIG(*) AS records
FROM dbo.Users AS u
JOIN dbo.Votes AS v
    ON v.UserId = u.Id;
Post Id
/*Post Id*/
SELECT COUNT_BIG(*) AS records
FROM dbo.Posts AS p
JOIN dbo.Comments AS c
    ON c.PostId = p.Id;

SELECT COUNT_BIG(*) AS records
FROM dbo.Posts AS p
JOIN dbo.Votes AS v
    ON v.PostId = p.Id;
Note-ry
A couple things to note, here:
Joining Users to Votes is unreliable, because most of the voting is anonymized in the dump
Things get much more interesting when you start building queries within relationships
For example, using the User Id columns in tables that aren’t users to join larger tables together, or joining Comments to Votes on Post Id.
You can really start to feel your CPU fans.
Thanks for reading!
Going Further
If this is the kind of SQL Server stuff you love learning about, you’ll love my training. I’m offering a 75% discount to my blog readers if you click from here. I’m also available for consulting if you just don’t have time for that and need to solve performance problems quickly.
Speaking daily with Joe is one of the best choices I’ve ever made. Not only do I regularly learn things about SQL Server that I would probably not run into, but he’s quite a character. That’s why when I started to help organize SQL Saturday NYC, I was more than happy to offer him a precon.
While it may be impractical to have more Joes in the world, it’s very practical to have people learn from him.
So what did I learn from his precon?
Column store is Different
How you load data into tables matters a lot. Not only is the number of rows you insert at a time crucial, but all sorts of things from the column data types to the inserted values can work for or against you. This can affect compression, query performance, and how well data loading scales.
The other place where column store differs from row store indexes is that maintenance is important. Yes, the very maintenance that’s an absurd crutch to row store indexes can be make or break to column store performance. Right now, the only two solutions that have special rules for column store indexes are Niko Neugebauer’s CISL scripts, and the Tiger Team’s Adaptive Defrag. Other maintenance solutions aren’t taking the right things into account.
Modifications Are Harsh! Deleting and Updating rows in column store indexes can have some nasty side effects — the kind that make maintenance necessary.
Performance Tuning Is Wild
If you’re dealing with column store indexes, chances are you’re dealing with some really big tables. While that by itself doesn’t change how you tune queries, you do have to remind yourself that “missing indexes” aren’t going to be the answer. You also need to keep in mind that some operators and query constructs don’t allow for good segment/row group elimination. You can think of those like partition elimination in a partitioned table. You can skip large amounts of data irrelevant to your query.
Strings Are The Devil
That’s all. Avoid them.
Details Are In The Devil
I’m not giving away too much here, because I hope Joe will deliver this again. If you see it pop up in your area, buy tickets ASAP.
Thanks for reading!
Going Further
If this is the kind of SQL Server stuff you love learning about, you’ll love my training. I’m offering a 75% discount to my blog readers if you click from here. I’m also available for consulting if you just don’t have time for that and need to solve performance problems quickly.
There’s a known bug with partitioned tables, but this is different. This one is with rows in the delta store.
Here’s a quick repro:
USE tempdb;

DROP TABLE IF EXISTS dbo.busted;

CREATE TABLE dbo.busted ( id BIGINT, INDEX c CLUSTERED COLUMNSTORE );

INSERT INTO dbo.busted WITH ( TABLOCK )
SELECT     TOP ( 50000 )
           1
FROM       master..spt_values AS t1
CROSS JOIN master..spt_values AS t2
OPTION ( MAXDOP 1 );

-- reports 0, should be 50k
SELECT CAST(OBJECTPROPERTYEX(OBJECT_ID('dbo.busted'), N'Cardinality') AS BIGINT) AS [where_am_i?];
SELECT COUNT_BIG(*) AS records
FROM   dbo.busted;

INSERT INTO dbo.busted WITH ( TABLOCK )
SELECT     TOP ( 150000 )
           1
FROM       master..spt_values AS t1
CROSS JOIN master..spt_values AS t2
OPTION ( MAXDOP 1 );

-- reports 150k, should be 200k
SELECT CAST(OBJECTPROPERTYEX(OBJECT_ID('dbo.busted'), N'Cardinality') AS BIGINT) AS [where_am_i?];
SELECT COUNT_BIG(*) AS records
FROM   dbo.busted;

SELECT object_NAME(csrg.object_id) AS table_name, *
FROM sys.column_store_row_groups AS csrg
ORDER BY csrg.total_rows;
In Pictures
In Particular
This is the interesting bit, because you can obviously see the difference between open and compressed row groups.
Give us money
The 50k rows in the delta store aren’t counted towards table cardinality.
Thanks for reading!
Going Further
If this is the kind of SQL Server stuff you love learning about, you’ll love my training. I’m offering a 75% discount to my blog readers if you click from here. I’m also available for consulting if you just don’t have time for that and need to solve performance problems quickly.
I thought it could be helpful to go into more detail for what I plan to present at the columnstore precon that’s part of SQL Saturday New York City. Note that everything here is subject to change. I tried to include all of the main topics planned at this time. If you’re attending and really want to see something covered, let me know and I’ll be as transparent as possible about what I can and cannot do.
Part 1: Creating your table
Definitions
Delta rowgroups
How columnstore compression works
What can go wrong with compression
Picking the right data types
Deciding on partitioning
Indexing
When should you try columnstore?
Part 2: Loading data quickly
Serial inserts
Parallel inserts
Inserts into partitioned tables
Inserts to preserve order
Deleting rows
Updating rows
Better alternatives
Trickle insert – this is a maybe
Snapshot isolation and ADR
Loading data on large servers
Part 3: Querying your data
The value of maintenance
The value of patching
How I read execution plans
Columnstore/batch mode gotchas with DMVs and execution plans
In yesterday’s post, we looked at plans with a good index. The row number queries were unfortunate, but the MAX and TOP 1 queries did really well.
Today, I wanna see what the future holds. I’m gonna test stuff out on SQL Server 2019 CTP 3.1 and see how things go.
I’m only going to hit the interesting points. If plans don’t change, I’m not gonna go into them.
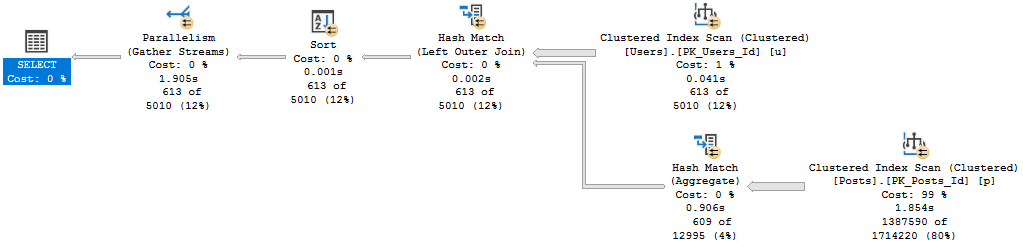
Query #1
With no indexes, this query positively RIPS. Batch Mode For Row Store kicks in, and this finishes in 2 seconds.
SELECT u.Id,
       u.DisplayName,
	   u.Reputation,
	   ca.Score
FROM dbo.Users AS u
CROSS APPLY
(
    SELECT MAX(Score) AS Score
	FROM dbo.Posts AS p
	WHERE p.OwnerUserId = u.Id

) AS ca
WHERE u.Reputation >= 100000
ORDER BY u.Id;
So many illustrations
With an index, we use the same plan as in SQL Server 2017, and it finishes in around 200 ms.
No big surprise there. Not worth the picture.
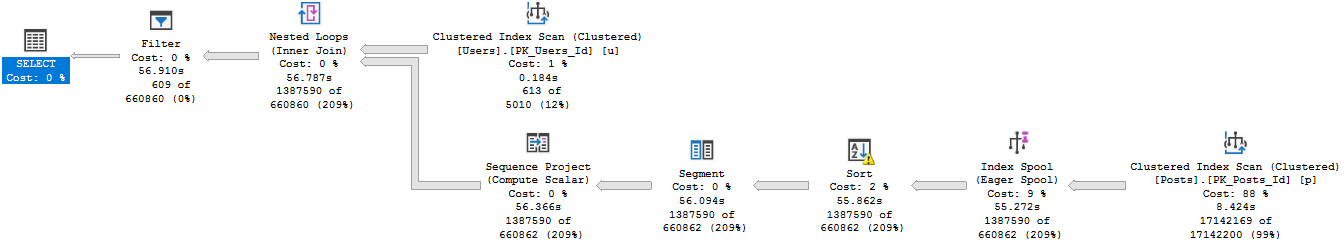
Query #2
Our TOP 1 query should be BOTTOM 1 here. It goes back to its index spooling ways, and runs for a minute.
SELECT u.Id,
       u.DisplayName,
	   u.Reputation,
	   ca.Score
FROM dbo.Users AS u
CROSS APPLY
(
    SELECT TOP (1) p.Score
	FROM dbo.Posts AS p
	WHERE p.OwnerUserId = u.Id
	ORDER BY p.Score DESC

) AS ca
WHERE u.Reputation >= 100000
ORDER BY u.Id;
With an index, we use the same plan as in SQL Server 2017, and it finishes in around 200 ms.
No big surprise there. Not worth the picture.
I feel like I’m repeating myself.
Query #3
This is our first attempt at row number. It’s particularly disappointing when we see the next query plan.
SELECT u.Id,
       u.DisplayName,
	   u.Reputation,
	   ca.Score
FROM dbo.Users AS u
CROSS APPLY
(
    SELECT p.Score,
	       ROW_NUMBER() OVER (ORDER BY p.Score DESC) AS n
	FROM dbo.Posts AS p
	WHERE p.OwnerUserId = u.Id
) AS ca
WHERE u.Reputation >= 100000
AND ca.n = 1
ORDER BY u.Id;
On its own, it’s just regular disappointing.
Forget Me
Serial. Spool. 57 seconds.
With an index, we use the same plan as in SQL Server 2017, and it finishes in around 200 ms.
No big surprise there. Not worth the picture.
I feel like I’m repeating myself.
Myself.
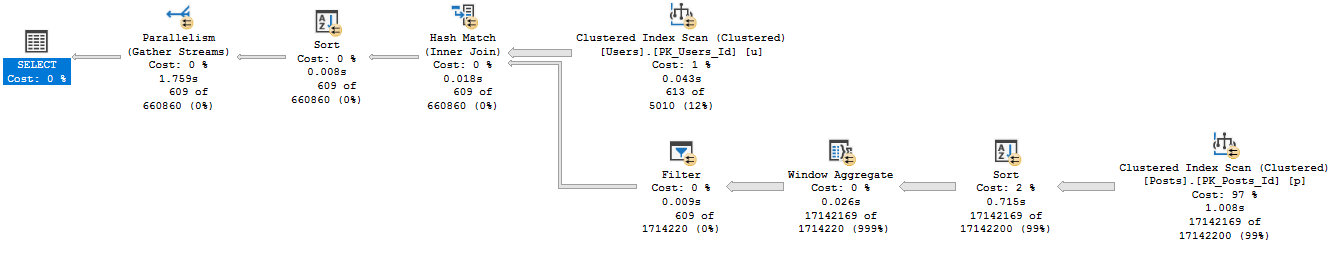
Query #4
Why this plan is cool, and why it makes the previous plans very disappointing, is because we get a Batch Mode Window Aggregate.
SELECT u.Id,
       u.DisplayName,
	   u.Reputation,
	   ca.Score
FROM dbo.Users AS u
CROSS APPLY
(
    SELECT *
	FROM
	(
        SELECT p.OwnerUserId,
	           p.Score,
	           ROW_NUMBER() OVER (PARTITION BY p.OwnerUserId
			                      ORDER BY p.Score DESC) AS n
	    FROM dbo.Posts AS p
	) AS p
	WHERE p.OwnerUserId = u.Id
	AND p.n = 1
) AS ca
WHERE u.Reputation >= 100000
ORDER BY u.Id;
Guillotine
It finishes in 1.7 seconds. This is nice. Good job, 2019.
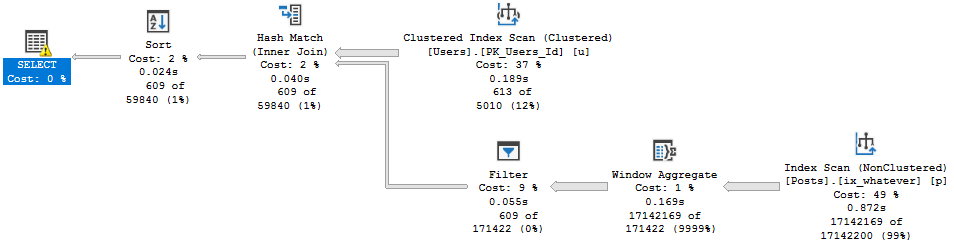
With the index we get a serial Batch Mode plan, which finishes in about 1.4 seconds.
Confused.
If you’re confused about where 1.4 seconds come from, watch this video.
Why Aren’t You Out Yet?
SQL Server 2019 did some interesting things, here.
In some cases, it made fast queries faster.
In other cases, queries stayed… exactly the same.
When Batch Mode kicks in, you may find queries like this speeding up. But when it doesn’t, you may find yourself having to do some good ol’ fashion query and index tuning.
No big surprise there. Not worth the picture.
I feel like I’m repeating myself.
Myself.
Myself.
Going Further
If this is the kind of SQL Server stuff you love learning about, you’ll love my training. I’m offering a 75% discount to my blog readers if you click from here. I’m also available for consulting if you just don’t have time for that and need to solve performance problems quickly.
If this is the kind of SQL Server stuff you love learning about, you’ll love my training. I’m offering a 75% discount to my blog readers if you click from here. I’m also available for consulting if you just don’t have time for that and need to solve performance problems quickly.
Thanks for watching!
Going Further
If this is the kind of SQL Server stuff you love learning about, you’ll love my training. I’m offering a 75% discount to my blog readers if you click from here. I’m also available for consulting if you just don’t have time for that and need to solve performance problems quickly.
A delta rowgroup is a clustered index that’s used only with columnstore indexes. It improves columnstore compression and performance by storing rows until the number of rows reaches a threshold and are then moved into the columnstore.
This clustered index isn’t chosen by the person who creates the table. It’s a hidden internal column automatically added to delta rowgroups. Perhaps the implementation is similar to that of table spools:
The worktable is structured as if it was defined with a clustered index on zero columns. This means that a 4-byte uniqueifier is added to each row stored except the first.
You know how programmers are: they love reusing old code. If a similar implementation is used for delta rowgroups then it should be possible to see SQL Server errors with the right pattern of data loading. More investigation is required.
Defining the rules
It might be possible to find evidence of this clustered index by using DBCC PAGE. In the T-SQL code below, I create a table clustered columnstore index, insert 500 rows, delete 499 rows, insert 500 more rows, and delete 499 rows again:
CREATE TYPE dbo.SEAN_GALLARDY_INT FROM SMALLINT NOT NULL;

DROP TABLE IF EXISTS dbo.view_hidden_clustered_index;

CREATE TABLE dbo.view_hidden_clustered_index (
	ID SEAN_GALLARDY_INT,
	INDEX CCI CLUSTERED COLUMNSTORE
);

GO

CREATE OR ALTER PROCEDURE #p AS
BEGIN
	SET NOCOUNT ON;

	DECLARE @value_to_insert INT = 1;

	WHILE @value_to_insert <= 500
	BEGIN
		INSERT INTO dbo.view_hidden_clustered_index VALUES (@value_to_insert);

		SET @value_to_insert = @value_to_insert + 1;
	END;

	DELETE FROM dbo.view_hidden_clustered_index
	WHERE ID < 500;

	WHILE @value_to_insert <= 1000
	BEGIN
		INSERT INTO dbo.view_hidden_clustered_index VALUES (@value_to_insert);

		SET @value_to_insert = @value_to_insert + 1;
	END;

	DELETE FROM dbo.view_hidden_clustered_index
	WHERE ID > 500 AND ID < 1000;
END;

GO

EXEC #p;
There’s only a single page that stores the 2 rows currently held by the table. This can be viewed with the undocumented DBCC PAGE, TF 3604, and the undocumented sys.dm_db_database_page_allocations:
DECLARE @file_id SEAN_GALLARDY_INT;
DECLARE @page_id INT;

SELECT @file_id = allocated_page_file_id, @page_id = allocated_page_page_id
FROM sys.dm_db_database_page_allocations
    (DB_ID(), OBJECT_ID('dbo.view_hidden_clustered_index'),NULL, NULL, 'DETAILED')
WHERE is_allocated = 1 AND allocation_unit_type = 1 AND is_iam_page = 0 and page_type = 1;

DBCC TRACEON(3604);
DBCC PAGE('TEST',@file_id,@page_id,3) WITH TABLERESULTS;
DBCC TRACEOFF(3604);
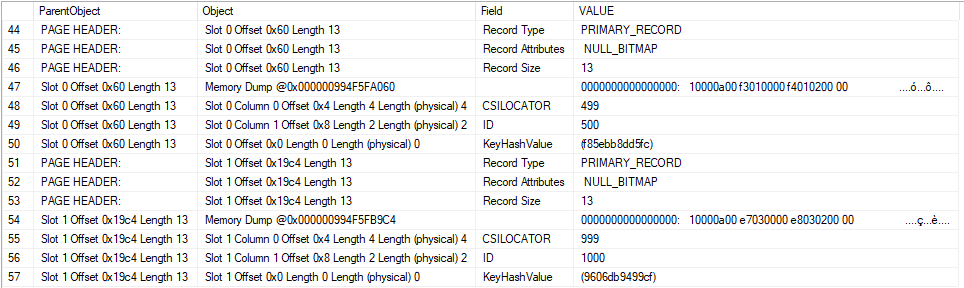
The information that we’re looking for is near the bottom of the result set:
A few things are worth calling out. The 500th row that was inserted into the table has a value of 499 for the “CSILOCATOR” field. This value appears to be stored in little-endian format in the memory dump for Slot 0 Offset 0x60. You can decode the raw value to 499 in T-SQL if desired:
SELECT CAST(0x000001F3 AS INT);
The 1000th row that was inserted into the table into the table has a value of 999 for the CSILOCATOR field. Most importantly, this CSILOCATOR field has a length of four bytes. A typical four byte int in SQL Server has a maximum value of 2147483647. If it’s possible to load billions of rows into a single delta rowgroup then we may run out of values for the CSILOCATOR field.
Of course, a single delta rowgroup cannot hold more than 1048576 rows. As you can see in this example, SQL Server does not always reuse freed up values for the CSILOCATOR field. The table currently has two rows, yet the field has advanced to 999. The right pattern of deletes, inserts, and updates should allow the CSILOCATOR to continue to grow without running out of room for rows in the delta rowgroup.
As a final note, I cannot prove that the CSILOCATOR field corresponds to the clustered index, but it certainly seems to serve the function of a uniqueifier that would be needed for said clustered index.
Running up the score
I need to find a relatively efficient way to advance the CSILOCATOR because I need to do it over 2 billion times, if my theory is correct about the maximum allowed value. Both updating all of the rows in a delta rowgroup and deleting and reinserting advance the CSILOCATOR. I expected that small batch sizes would work best, and they did. For my table’s schema, the sweet spot for updates is about 275 rows and the sweet spot for delete/inserts is about 550 rows. Delete/inserts appeared to be faster than updates for the purpose of constantly reloading the same rows over and over.
Strategies that use multiple CPU cores are possible, but I wanted to do other work on this PC and didn’t want to listen to a loud fan all day. Here’s what the final testing code looked like:
DROP TABLE IF EXISTS dbo.delta_store_test;

CREATE TABLE dbo.delta_store_test (
	ID TINYINT NOT NULL,
	INDEX CCI CLUSTERED COLUMNSTORE
);


DROP TABLE IF EXISTS dbo.LOG_TABLE;

CREATE TABLE dbo.LOG_TABLE (
	log_time DATETIME,
	loop_count INT,
	PRIMARY KEY (log_time)
);

GO

DROP TABLE IF EXISTS dbo.delta_store_source;
CREATE TABLE dbo.delta_store_source (
	ID TINYINT NOT NULL
);

INSERT INTO dbo.delta_store_source
SELECT TOP (550) 1
FROM master..spt_values t1
OPTION (MAXDOP 1);

GO

CREATE OR ALTER PROCEDURE #p AS
BEGIN
	SET NOCOUNT ON;

	DECLARE @loops INT = 0;

	WHILE @loops <= 8000000
	BEGIN
		DELETE FROM dbo.delta_store_test

		INSERT INTO dbo.delta_store_test
		SELECT 1
		FROM dbo.delta_store_source WITH (TABLOCK);

		SET @loops = @loops + 1;

		IF @loops % 10000 = 0
		BEGIN
			INSERT INTO dbo.LOG_TABLE
			VALUES (GETDATE(), @loops);
		END;
	END;
END;

GO

EXEC #p;
If you’re wondering about the temporary stored procedure creation, it’s a habit that I’ve gotten into whenever I write a T-SQL while loop. While not applicable here, very fast loops can incur ASYNC_NETWORK_IO overhead due to the passing of DONE tokens to the client.
Winning the game
After about seven hours the code reaches its glorious end:
Msg 666, Level 16, State 2, Procedure #p, Line 11 [Batch Start Line 26]
The maximum system-generated unique value for a duplicate group was exceeded for index with partition ID 72057596406595584. Dropping and re-creating the index may resolve this; otherwise, use another clustering key.
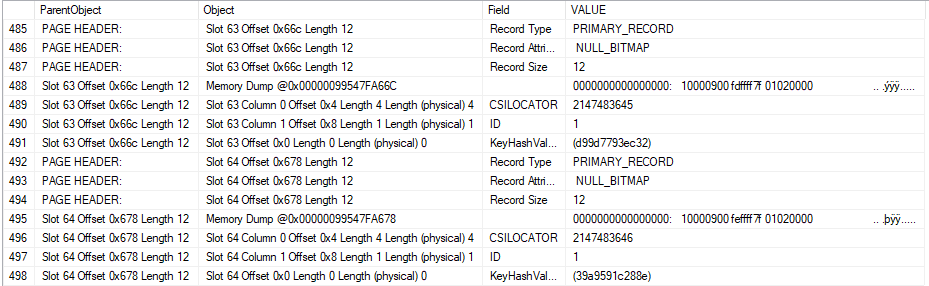
I loaded a few more rows into the table until I was unable to insert even one row. Using DBCC PAGE and friends again, we can see that the CSILOCATOR has a very large value of 2147483646.
Issuing a REBUILD does resolve the issue because it wipes away our sins, as REBUILDs often do. Naturally using another clustering key is not an option.
Joe: 1
Microsoft: 0
The cost of playing
My desktop computer has an intel core i5-4670 processor. Intel claims a TDP of 84 watts. Using CPUID HWMonitor, it looks like my CPU uses about 15 W of additional power when running the workload. It’s a single core workload, so I feel that 15 W is reasonable. 15 watts is 0.015 kW, and when used over 7 hours it translates to 0.105 kWh. My last electric bill has a rate of $0.11663 per kWh, so the total cost of this test comes out to about 1.2 cents. I will be sending Erik an invoice.
Final thoughts
It is possible to hit error 666 when maliciously loading data into a columnstore index. It requires loading over 2 billion rows into the same delta rowgroup, so it’s difficult to think of a production scenario that would lead to this outcome. For those of you with eccentric workloads that give cause for concern, you can roughly check if you are running of IDs by running a query similar to the following for each columnstore table:
SELECT 2147483647 - 1 - MAX(CAST(SUBSTRING(%%physloc%%, 5, 4) AS INT)) REMAINING_CSILOCATORS
FROM dbo.delta_store_test;
A KB article was recently published that suggested that memory time-out behavior was changed for CCI inserts:
When you try to create a Columnstore Index on a table in Microsoft SQL Server 2016 or 2017, the request may fail after 25 seconds with memory time-out error 8645, depending on how many memory consuming queries are running concurrently and/or how much memory is available at the time of the request. The memory time-out error may occur even when you configure longer memory request time-out at an instance level or at a resource pool level.
I’ve never seen that error occur for serial inserts. Serial inserts time out after 25 seconds and execute with minimum required memory. They write directly to the delta store instead of attempting compression. So it looked like this change affects parallel inserts but the details weren’t at all clear to me.
Time out for time-outs
Why should we care about memory grant timeouts for CCI insert queries? Simply put, lots of bad things can happen when those queries can time out, both for serial and for parallel inserts. For serial insert queries, I’ve observed deadlocks, extremely poor performance along with long SLEEP_TASK waits, and extremely long rollbacks. For parallel insert queries, I’ve observed queries that run seemingly forever, poor performance of the SELECT part, and error 8645. You probably don’t want any of that occurring in production. It would be very helpful if it was possible to extend the 25 second time-out for queries that insert into columnstore tables.
Time out for time-outs
I’ve found it extremely useful to keep around a 2017 RTM environment with no CUs to figure when issues related to columnstore were introduced into the product. First we’ll take a look at the behavior on 2017 RTM to see error 8645 in action. I want a relatively simple parallel insert query that will run for longer than 25 seconds and will take a large memory grant. I decided on the following query:
INSERT INTO dbo.TARGET_CCI_1 WITH (TABLOCK)
SELECT ca.SLOW, ca.INFLATE_GRANT
FROM (VALUES (0), (1), (2), (3)) v(x)
CROSS APPLY (
	SELECT TOP (1048576) sc.SLOW, sc.INFLATE_GRANT
	FROM dbo.SLOW_TO_COMPRESS sc
	WHERE sc.FOR_SEEKING = v.x
) ca
OPTION (MAXDOP 2);
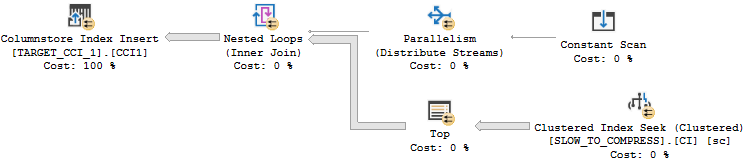
I get the properties that I’m after with a few undocumented tricks. The inflate grant column is a VARCHAR(8000) column. That data type significantly increases the memory grant for parallel inserts even with all NULLs. For the SLOW column, I’m loading integers evenly distributed between 0 and 7999. That data pattern can take longer than expected to compress. The worst case is with around 16000 distinct evenly distributed integers. If you’d like to understand why check out this answer by Paul White. Finally, the CROSS APPLY pattern means that I’ll get demand-based parallelism with each nested loop execution reading exactly enough rows from SLOW_TO_COMPRESS to fill up one rowgroup. It may be helpful to look at the query plan:
The query takes about 40 seconds to execute on my machine. If you’d like to follow along at home, set max server memory to 8000 MB and run the following code:
DROP TABLE IF EXISTS dbo.SLOW_TO_COMPRESS;

CREATE TABLE dbo.SLOW_TO_COMPRESS (
	FOR_SEEKING INT NULL,
	SLOW BIGINT NULL,
	INFLATE_GRANT VARCHAR(8000) NULL
);

CREATE CLUSTERED INDEX CI ON dbo.SLOW_TO_COMPRESS
(FOR_SEEKING);

INSERT INTO dbo.SLOW_TO_COMPRESS WITH (TABLOCK)
SELECT q.RN / 1048576, RN % 10000, NULL
FROM
(
	SELECT TOP (4 * 1048576) -1 + ROW_NUMBER()
		OVER (ORDER BY (SELECT NULL)) RN
	FROM master..spt_values t1
	CROSS JOIN master..spt_values t2
) q
OPTION (MAXDOP 1);

GO

DECLARE @table_id INT = 1,
@sql NVARCHAR(4000);

WHILE @table_id <= 6
BEGIN
	SET @sql = N'DROP TABLE IF EXISTS dbo.TARGET_CCI_'
	 + CAST(@table_id AS NVARCHAR(2))
	 + N'; CREATE TABLE dbo.TARGET_CCI_'
	 + CAST(@table_id AS NVARCHAR(2))
	 + N'(
		SLOW BIGINT NULL,
		INFLATE_GRANT VARCHAR(8000) NULL,
		INDEX CCI1 CLUSTERED COLUMNSTORE
	)';

	EXEC sp_executesql @sql;

	SET @table_id = @table_id + 1;
END;

GO

CREATE OR ALTER PROCEDURE dbo.INSERT_INTO_TARGET_CCI
(@table_id INT)
AS
BEGIN

DECLARE @sql NVARCHAR(4000) = N'INSERT INTO dbo.TARGET_CCI_'
+ CAST(@table_id AS NVARCHAR(2))
+ N' WITH (TABLOCK)
SELECT ca.SLOW, ca.INFLATE_GRANT
FROM (VALUES (0), (1), (2), (3)) v(x)
CROSS APPLY (
	SELECT TOP (1048576) sc.SLOW, sc.INFLATE_GRANT
	FROM SLOW_TO_COMPRESS sc
	WHERE sc.FOR_SEEKING = v.x
) ca
OPTION (MAXDOP 2)';

EXEC sp_executesql @sql;

END;
Error code 8645
Batch files that call sqlcmd are a convenient way to kick off lots of queries. For example:
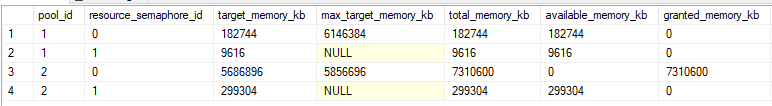
Note that I do not have Resource Governor enabled. If I kick off five queries at once using the batch file I don’t get an error. After 25 seconds two of the five queries are able to execute with the same memory grant as others:
It does make me uncomfortable to see query memory grants exceed the target memory for the semaphore by so much, but at least it’s not over max server memory:
I ran the same test but kicked off a sixth query in SSMS. After 25 seconds I saw the following error for the sixth query:
Msg 8645, Level 17, State 1, Line 1
A timeout occurred while waiting for memory resources to execute the query in resource pool ‘default’ (2). Rerun the query.
I want my lawyer
On SQL Server 2017 CU14 I ran a variety of tests by changing the memory time-out settings at the Resource Governor query level or at the instance level. I tried different Resource Governor pools and even serial queries. I still saw a timeout of 25 seconds no matter what I did. I contacted the attorney that I keep on retainer to help me interpret SQL Server KB articles. Let’s review the relevant text again:
When you try to create a Columnstore Index on a table in Microsoft SQL Server 2016 or 2017, the request may fail after 25 seconds with memory time-out error 8645, depending on how many memory consuming queries are running concurrently and/or how much memory is available at the time of the request. The memory time-out error may occur even when you configure longer memory request time-out at an instance level or at a resource pool level.
He pointed out that the article doesn’t actually say that the time-out is now configurable. Just that it wasn’t configurable in the past. The symptom may strictly describe error 8645. So perhaps the adjustment was very narrow and has to do with avoiding that error only. Fair enough. I ran the same test that say error 8645 on RTM and the sixth query still hit error 8645.
Two of these things aren’t like the others
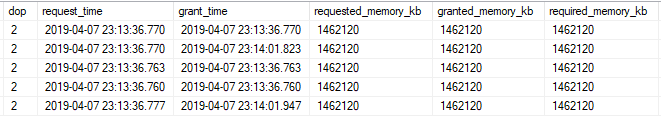
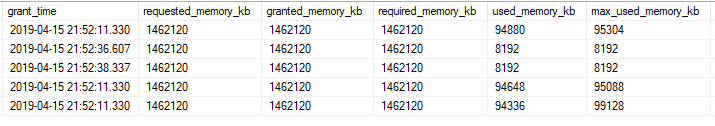
Let’s kick off five queries on CU14 and take another look at sys.dm_exec_query_memory_grants:
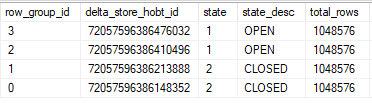
That’s odd. The two queries that hit the 25 second timeout have lower values for max_used_memory_kb than the queries that didn’t time out, even though the memory grants are the same. Looking at sys.dm_db_column_store_row_group_physical_stats for one of the tables with the lower memory grant:
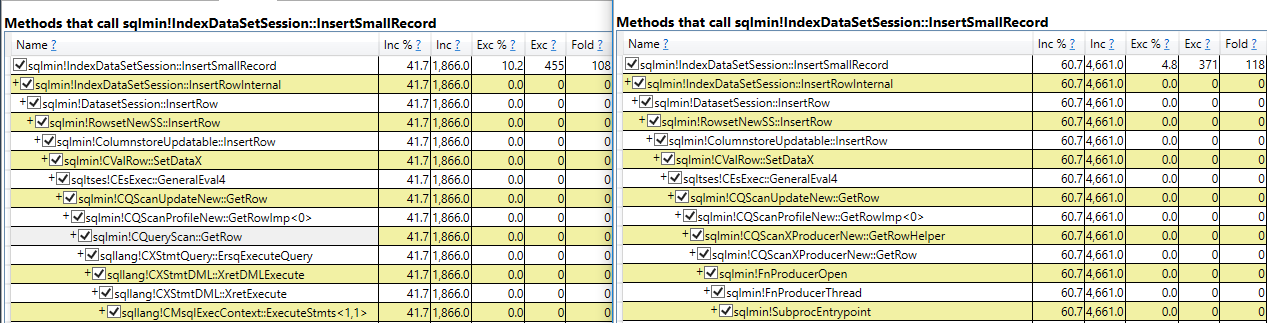
All rows were written to delta stores even though each thread got over 2 million rows. The query still takes its required memory grant but it doesn’t use most of the part reserved for columnstore compression. My best guess is that this is the change described in the KB article. A superficial glance suggests that the internal implementation is the same one used for writing to a delta store in serial:
I think that I can understand the argument for making this change. However, I see intermittent intra-query parallel deadlocks when queries time out in this way:
Msg 1205, Level 13, State 78, Line 1
Transaction (Process ID 61) was deadlocked on lock | communication buffer resources with another process and has been chosen as the deadlock victim. Rerun the transaction.
I’ve also seen this error as well when going too far above target memory:
Msg 701, Level 17, State 123, Line 1
There is insufficient system memory in resource pool ‘default’ to run this query.
Personally, I’d like to see clearly defined behavior that focus on stability. When writing code that does parallel inserts into columnstore indexes it may be desirable to catch errors 8645, 1205, and 701 and to retry the insert after rolling back, perhaps at MAXDOP 1.
Final thoughts
Kb articles for SQL Server fixes can sometimes be misleading because they may focus on how the problem was described in a support ticket even if the scope of the fix or the solution have little to nothing to do with said description. After reading KB article 4480641 you could easily think that error code 8645 no longer occurs with parallel columnstore inserts or that it’s possible to override the 25 second memory timeout for columnstore inserts. Neither one of those is true. Parallel inserts into columnstore tables can still exceed target memory, but they write to multiple delta stores if they hit their 25 second timeout. Thanks for reading!
Columnstore has quite a few different tricks for compressing data. This blog post explores if it’s possible for a rowstore table to beat columnstore compression, even in the best case scenario for the columnstore table (no delta stores and rowgropus of the maximum size).
Page Compression and String Data
Everybody knows that strings aren’t the best fit for columnstore tables. Let’s start by puting sequential integers from 1 to 1048576 into a page compressed table:
DROP TABLE IF EXISTS dbo.RS_VARCHAR33;
GO
CREATE TABLE dbo.RS_VARCHAR33 (
	ID1 VARCHAR(33)
) WITH (DATA_COMPRESSION = PAGE);

INSERT INTO dbo.RS_VARCHAR33 WITH (TABLOCK)
SELECT TOP (1048576) ROW_NUMBER()
	OVER (ORDER BY (SELECT NULL)) ID
FROM master..spt_values t1
CROSS JOIN master..spt_values t2
OPTION (MAXDOP 1);
According to sp_spaceused, the table takes up 11464 KB of space. Next load the same data into a columnstore table:
DROP TABLE IF EXISTS dbo.CCI_VARCHAR33;
GO
CREATE TABLE dbo.CCI_VARCHAR33 (
	ID1 VARCHAR(33),
	INDEX C CLUSTERED COLUMNSTORE
);

INSERT INTO dbo.CCI_VARCHAR33 WITH (TABLOCK)
SELECT TOP (1048576) ROW_NUMBER()
	OVER (ORDER BY (SELECT NULL)) ID
FROM master..spt_values t1
CROSS JOIN master..spt_values t2
OPTION (MAXDOP 1);
The CCI takes up 14408 KB of space. The majority of the space is used for the dictionary. The follow query returns 11495348 bytes:
SELECT csd.on_disk_size
FROM sys.column_store_dictionaries csd
INNER JOIN sys.partitions sp
	ON csd.partition_id = sp.partition_id
WHERE sp.[object_id] = OBJECT_ID('CCI_VARCHAR33');
Data types matter here. If I change the CCI to have a VARCHAR(32) column instead then the table only requires 1800 KB of space. A dictionary is not created in this case. A takeaway is that SQL Server may choose to create a dictionary based on the length of the defined string column. Data sets with many unique strings may require a relatively large amount of space for the dictionary, even to the point where page compressed data can have overall a lower footprint on the database.
Page Compression and Non-string Data
It’s certainly more difficult to come up with a demo that works without string columns, but consider how the page compression algorithm works. Data can be compressed on page basis, which includes both multiple rows and multiple columns. That means that page compression can achieve a higher compression ratio when a row has identical values in different columns. Columnstore is only able to compress on an individual column basis and you won’t directly see better compression with repeated values in different columns for a single row (as far as I know).
The table defined and populated below requires 11912 KB of disk space:
DROP TABLE IF EXISTS dbo.RS_4_COLUMN;
GO
CREATE TABLE dbo.RS_4_COLUMN (
	ID1 BIGINT,
	ID2 BIGINT,
	ID3 BIGINT,
	ID4 BIGINT
) WITH (DATA_COMPRESSION = PAGE);

INSERT INTO dbo.RS_4_COLUMN WITH (TABLOCK)
SELECT ID, ID, ID, ID
FROM (
	SELECT TOP (1048576) ROW_NUMBER()
		OVER (ORDER BY (SELECT NULL)) / 10 ID
	FROM master..spt_values t1
	CROSS JOIN master..spt_values t2
) q
OPTION (MAXDOP 1);
If I rerun the code with five columns, the table now takes up 13000 KB of space. That’s only an increase of 9% in space to hold 25% more data. The same data loaded into a columnstore table with four columns takes 11272 KB of space. Adding one column results in a total size of 14088 KB, which is almost exactly a 25% increase. For this data set with five columns, page compression across rows is more efficient than standard columnstore compression.
Row Compression and Non-string Data
Row compression doesn’t allow for compression benefits from storing the same value in multiple columns. Is it possible to beat columnstore compression with row compression without string columns? You betcha!
DROP TABLE IF EXISTS #BATCH_MODE;
CREATE TABLE #BATCH_MODE (
	ID INT,
	INDEX C CLUSTERED COLUMNSTORE
);

DROP TABLE IF EXISTS dbo.RS_2_COLUMN_ROW_COMPRESSED;
GO
CREATE TABLE dbo.RS_2_COLUMN_ROW_COMPRESSED (
	ID1 BIGINT,
	ID2 BIGINT
) WITH (DATA_COMPRESSION = ROW);

INSERT INTO dbo.RS_2_COLUMN_ROW_COMPRESSED WITH (TABLOCK)
SELECT
  SUM(q.ID) OVER (ORDER BY q.ID)
, SUM(q.ID) OVER (ORDER BY q.ID)
FROM
(
	SELECT TOP (1048576) ROW_NUMBER()
		OVER (ORDER BY (SELECT NULL)) ID
	FROM master..spt_values t1
	CROSS JOIN master..spt_values t2
) q
LEFT OUTER JOIN #BATCH_MODE ON 1 = 0
OPTION (MAXDOP 1);

EXEC sp_spaceused 'RS_2_COLUMN_ROW_COMPRESSED';

DROP TABLE IF EXISTS #BATCH_MODE;
CREATE TABLE #BATCH_MODE (
	ID INT,
	INDEX C CLUSTERED COLUMNSTORE
);

DROP TABLE IF EXISTS dbo.CCI_2_COLUMN;
GO
CREATE TABLE dbo.CCI_2_COLUMN (
	ID1 BIGINT,
	ID2 BIGINT,
	INDEX C CLUSTERED COLUMNSTORE
);

INSERT INTO dbo.CCI_2_COLUMN WITH (TABLOCK)
SELECT
  SUM(q.ID) OVER (ORDER BY q.ID)
, SUM(q.ID) OVER (ORDER BY q.ID)
FROM
(
	SELECT TOP (1048576) ROW_NUMBER()
		OVER (ORDER BY (SELECT NULL)) ID
	FROM master..spt_values t1
	CROSS JOIN master..spt_values t2
) q
LEFT OUTER JOIN #BATCH_MODE ON 1 = 0
OPTION (MAXDOP 1);

EXEC sp_spaceused 'CCI_2_COLUMN';
In this example, the rowstore table has a total size of 15496 KB but the columnstore has a total size of 16840 KB. I’m honestly not sure why this happens. I did try to pick the unfriendliest data set to columnstore compression that I could: no repeated values and no obvious patterns in data. Perhaps there’s some additional overhead of compression that pushes it over the row compressed data.
Final Thoughts
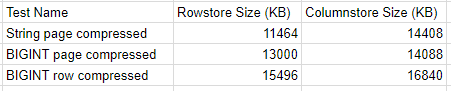
Columnstore doesn’t guarantee better compression than rowstore, even with perfectly sized rowgroups. Rowstore can provide better compression ratios for string columns, tables with repeated values across columns, and in other uncommon scenarios. A summary of test results is here:
The differences are small per rowgroup, but they can add up as more columns and more rows are added to the tables. I’ve seen tables in the real world that ended up bigger as columnstore compared to rowstore, which is what inspired me to look for some of these examples.
Thanks for reading!
Going Further
If this is the kind of SQL Server stuff you love learning about, you’ll love my training. I’m offering a 75% discount to my blog readers if you click from here. I’m also available for consulting if you just don’t have time for that and need to solve performance problems quickly.
Large servers may experience a scalability bottleneck related to the RESERVED_MEMORY_ALLOCATION_EXT wait event during loading of columnstore tables. This blog post shares a reproduction of the issue and discusses some test results.
The Test Server
Testing was done on a four socket bare metal server with 24 cores per socket. The server had 1 TB of RAM and storage was provided by a SAN. Within SQL Server, we were able to read data at a peak rate of about 5.5 GB/s. Hyperthreading was disabled, but there aren’t any other nonstandard OS configuration settings that I’m aware of.
SQL Server 2016 SP1 CU7 was installed on Windows Server 2016. Most default settings were retained for this testing, including allowing auto soft-NUMA to break up the 96 schedulers into 12 groups of 8, with 3 per memory node. Max server memory was set to around 800000 MB. The user database had 24 data files, indirect checkpoints weren’t used, and the memory model in use was conventional. No interesting trace flags were enabled, except perhaps for TF 4199. I did grow max server memory to close to the maximum before starting any of the tests.
Testing Code and Method
The workload test loaded the same data from a SQL Server table into 576 CCI target tables. For my testing I used a source table of one million rows. Each session grabs a number from a sequence, loads data into the table corresponding to the sequence number, and continues to do that until there are no more tables to process. This may seem like an odd test to run, but think of it as an abstract representation of a columnstore ETL workload which loads data into partitioned CCIs.
The first step is to define the source table. I created a 50 column table that stored only 0s in all of its rows. There’s nothing particularly special about this choice other that it has a very low disk footprint as a CCI because it compresses so well. On a non-busy system it took around 7.3 seconds to insert one million rows into a CCI. Below is the table definition:
Next we need a stored procedure that can save off previous test results (as desired) and reset the server for the next test. If a test name is passed in then results are saved to CCI_TEST_RESULTS and CCI_TEST_WAIT_STATS from the previous run. The procedure always recreates all of the target CCI tables, resets the sequence, clears the buffer pool, and does a few other things.
CREATE OR ALTER PROCEDURE [dbo].[CCI_TEST_RESET] (@PreviousTestName NVARCHAR(100) = NULL, @DebugMe INT = 0)
AS
BEGIN
	DECLARE
	@tablename SYSNAME,
	@table_number INT = 1,
	@SQLToExecute NVARCHAR(4000);

	/*
CREATE TABLE CCI_TEST_WAIT_STATS (
	TEST_NAME NVARCHAR(100),
	WAIT_TYPE NVARCHAR(60),
	WAITING_TASKS_COUNT BIGINT,
	WAIT_TIME_MS BIGINT,
	MAX_WAIT_TIME_MS BIGINT,
	SIGNAL_WAIT_TIME_MS BIGINT
);

CREATE TABLE CCI_TEST_RESULTS (
	TEST_NAME NVARCHAR(100),
	TOTAL_SESSION_COUNT SMALLINT,
	TEST_DURATION INT,
	TOTAL_WORK_TIME INT,
	BEST_TABLE_TIME INT,
	WORST_TABLE_TIME INT,
	TOTAL_TABLES_PROCESSED SMALLINT,
	MIN_TABLES_PROCESSED SMALLINT,
	MAX_TABLES_PROCESSED SMALLINT
);
	*/

	SET NOCOUNT ON;

	IF @DebugMe = 0
	BEGIN
		DROP SEQUENCE IF EXISTS CCI_PARALLEL_TEST_SEQ;
		CREATE SEQUENCE CCI_PARALLEL_TEST_SEQ
			AS SMALLINT
			START WITH 1
			INCREMENT BY 1
			CACHE 600;

		IF @PreviousTestName  N''
		BEGIN
			INSERT INTO CCI_TEST_RESULTS WITH (TABLOCK)
			SELECT @PreviousTestName,
			  COUNT(*) TOTAL_SESSION_COUNT
			, DATEDIFF(MILLISECOND, MIN(MIN_START_TIME), MAX(MAX_END_TIME)) TEST_DURATION
			, SUM(TOTAL_SESSION_TIME) TOTAL_WORK_TIME
			, MIN(MIN_TABLE_TIME) BEST_TABLE_TIME
			, MAX(MAX_TABLE_TABLE) WORST_TABLE_TIME
			, SUM(CNT) TOTAL_TABLES_PROCESSED
			, MIN(CNT) MIN_TABLES_PROCESSED
			, MAX(CNT) MAX_TABLES_PROCESSED
			FROM (
				SELECT
				  SESSION_ID
				, COUNT(*) CNT
				, SUM(DATEDIFF(MILLISECOND, START_TIME, END_TIME)) TOTAL_SESSION_TIME
				, MIN(DATEDIFF(MILLISECOND, START_TIME, END_TIME)) MIN_TABLE_TIME
				, MAX(DATEDIFF(MILLISECOND, START_TIME, END_TIME)) MAX_TABLE_TABLE
				, MIN(START_TIME) MIN_START_TIME
				, MAX(END_TIME) MAX_END_TIME
				FROM CCI_TEST_LOGGING_TABLE
				GROUP BY SESSION_ID
			) t;

			INSERT INTO CCI_TEST_WAIT_STATS WITH (TABLOCK)
			SELECT @PreviousTestName, * FROM sys.dm_os_wait_stats
			WHERE wait_type IN (
				'RESERVED_MEMORY_ALLOCATION_EXT'
				, 'SOS_SCHEDULER_YIELD'
				, 'PAGEIOLATCH_EX'
				, 'MEMORY_ALLOCATION_EXT'
				, 'PAGELATCH_UP'
				, 'PAGEIOLATCH_SH'
				, 'WRITELOG'
				, 'LATCH_EX'
				, 'PAGELATCH_EX'
				, 'PAGELATCH_SH'
				, 'CMEMTHREAD'
				, 'LATCH_SH'
			);

		END;

		DROP TABLE IF EXISTS CCI_TEST_LOGGING_TABLE;
		CREATE TABLE CCI_TEST_LOGGING_TABLE (
			SESSION_ID INT,
			TABLE_NUMBER INT,
			START_TIME DATETIME,
			END_TIME DATETIME
		);

	END;

	WHILE @table_number BETWEEN 0 AND 576
	BEGIN
		SET @tablename = N'CCI_PARALLEL_RPT_TARGET_' + CAST(@table_number AS NVARCHAR(3));
		SET @SQLToExecute= N'DROP TABLE IF EXISTS ' + QUOTENAME(@tablename);
		IF @DebugMe = 1
		BEGIN
			PRINT @SQLToExecute;
		END
		ELSE
		BEGIN
			EXEC (@SQLToExecute);
		END;

		SET @SQLToExecute = N'SELECT * INTO ' + QUOTENAME(@tablename) +
		' FROM CCI_SOURCE WHERE 1 = 0';
		IF @DebugMe = 1
		BEGIN
			PRINT @SQLToExecute;
		END
		ELSE
		BEGIN
			EXEC (@SQLToExecute);
		END;

		SET @SQLToExecute = N'CREATE CLUSTERED COLUMNSTORE INDEX CCI ON ' + QUOTENAME(@tablename);
		IF @DebugMe = 1
		BEGIN
			PRINT @SQLToExecute;
		END
		ELSE
		BEGIN
			EXEC (@SQLToExecute);
		END;

		SET @table_number = @table_number + 1;
	END;

	IF @DebugMe = 0
	BEGIN
		DBCC DROPCLEANBUFFERS WITH NO_INFOMSGS;
		DBCC FREEPROCCACHE WITH NO_INFOMSGS;
		DBCC FREESYSTEMCACHE('ALL');

		SELECT COUNT(*) FROM CCI_SOURCE; -- read into cache

		DBCC SQLPERF ("sys.dm_os_wait_stats", CLEAR) WITH NO_INFOMSGS;
		DBCC SQLPERF ("sys.dm_os_spinlock_stats", CLEAR) WITH NO_INFOMSGS;
	END;
END;
Finally we need a stored procedure that can be called to do as many CCI inserts as it can as quickly as possible. I used the following code:
CREATE OR ALTER PROCEDURE [dbo].[CCI_RUN_INSERTS] (@DebugMe INT = 0)
AS
BEGIN
	DECLARE @table_number INT,
	@tablename SYSNAME,
	@SQLToExecute NVARCHAR(4000),
	@start_loop_time DATETIME;

	SET NOCOUNT ON;

	SELECT @table_number = NEXT VALUE FOR CCI_PARALLEL_TEST_SEQ;

	WHILE @table_number BETWEEN 0 AND 576
	BEGIN
		SET @start_loop_time = GETDATE();

		SET @tablename = N'CCI_PARALLEL_RPT_TARGET_' + CAST(@table_number AS NVARCHAR(3));
		SET @SQLToExecute= N'
		INSERT INTO ' + QUOTENAME(@tablename) + N' WITH (TABLOCK)
		SELECT * FROM CCI_SOURCE WITH (TABLOCK)
		OPTION (MAXDOP 1)';

		IF @DebugMe = 1
		BEGIN
			PRINT @SQLToExecute;
		END
		ELSE
		BEGIN
			EXEC (@SQLToExecute);

			INSERT INTO CCI_TEST_LOGGING_TABLE VALUES (@@SPID, @table_number, @start_loop_time, GETDATE());
		END;

		SELECT @table_number = NEXT VALUE FOR CCI_PARALLEL_TEST_SEQ;
	END;
END;
To vary the number of concurrent queries I used sqlcmd. Each set of 12 sessions had the following format:
My workflow was to perform this test was to add the desired number of calls to the stored procedure in the .bat file, run the test, and to check the results to make sure that the test was a good one. If it was I saved off results using the reset procedure. If not I ran the reset procedure and tried again.
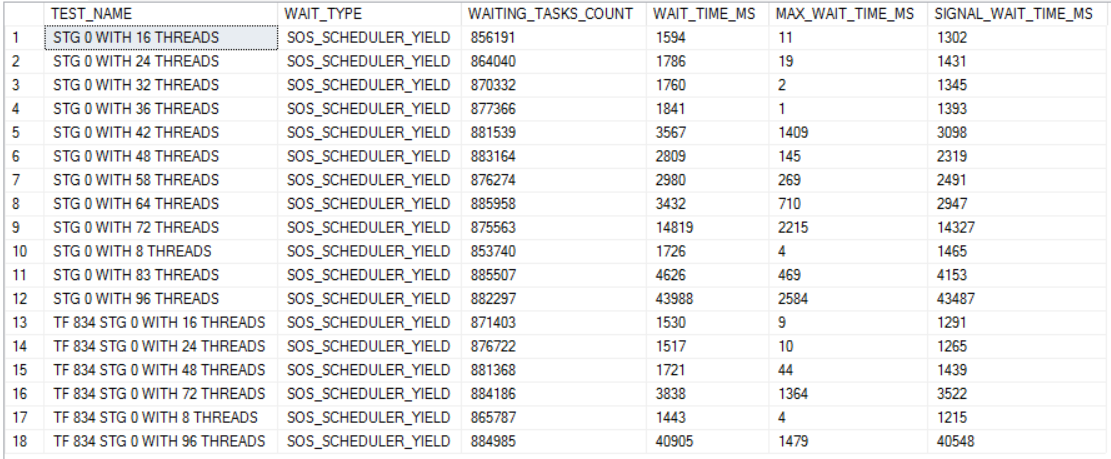
The ping command is there to add a small delay between sets of queries. I found that adding such a delay led to less doubling up on schedulers. I picked 12 because that's the number of soft-NUMA nodes. Sometimes tests would get quite a bit of SOS_SCHEDULER_YIELD waits which would mean that they couldn't be accurately compared to other tests. My fix was to just run the test again. It required a bit of patience but I never had to run a test more than once. SOS waits weren't eliminated but I'd say they fell to acceptable levels:
The right way to avoid SOS waits for testing like this (which might require every user session to go on its own scheduler) would be to set up 96 manual soft-NUMA nodes. But who has time for that?
Test Results
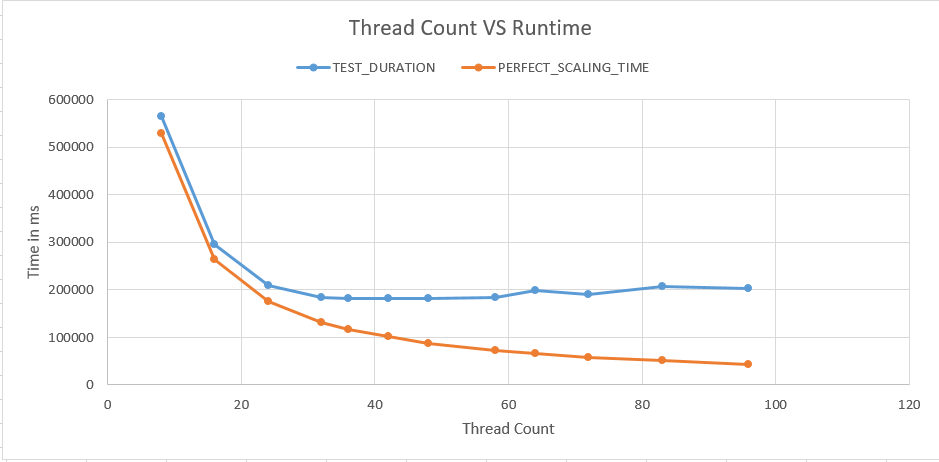
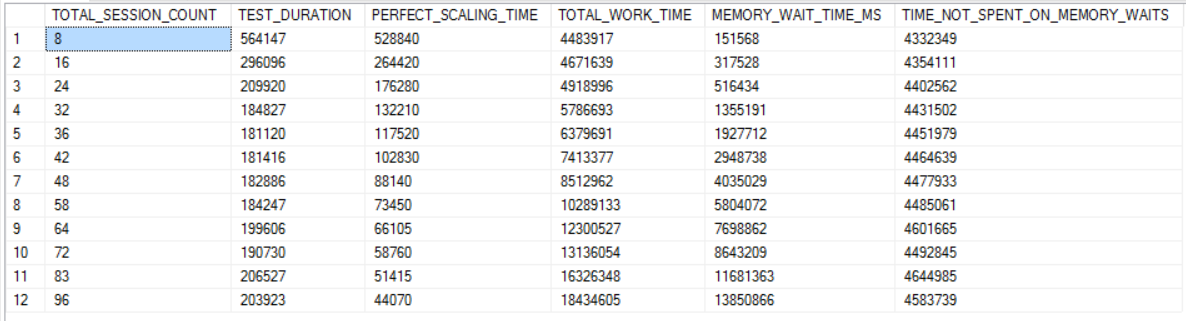
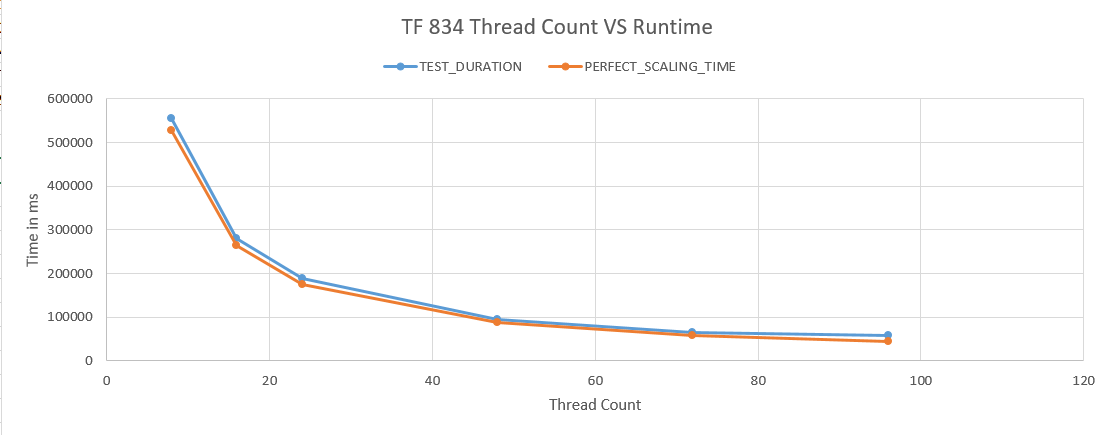
12 tests with different numbers of active queries were run. I picked numbers that somewhat evenly divided into 576 to try to keep work balanced between threads. The blue line in the chart below measures how long each test took from start to finish and the orange line represents how fast the test could have completed if there was no contention on the server whatsoever:
Naturally we can't expect the two lines to match perfectly, but improvements in runtime stop after going past 32 threads. In fact, the workload takes longer with 96 threads compared to 32 threads.
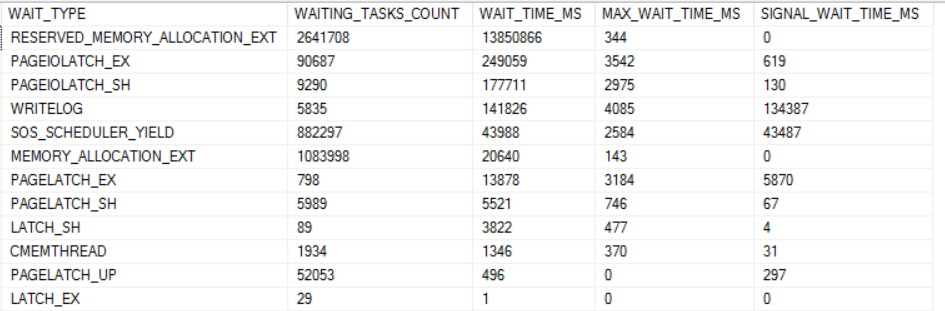
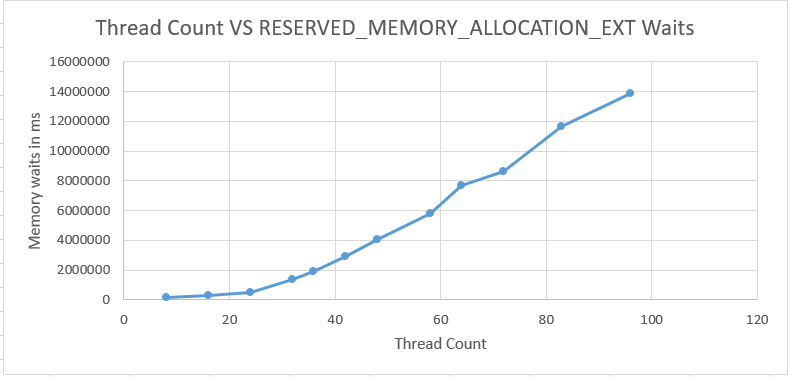
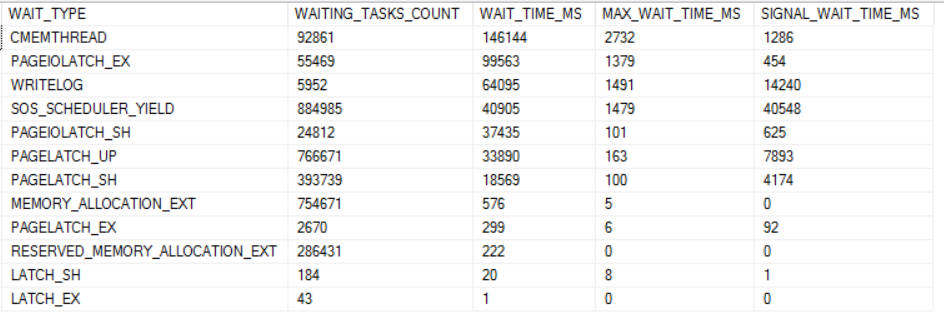
The dominant wait event for the higher thread count runs is RESERVED_MEMORY_ALLOCATION_EXT. Below is a chart of all of the wait events worth mentioning for the 96 thread run:
waiting, waiting
The total number of wait events for RESERVED_MEMORY_ALLOCATION_EXT is very consistent between runs. However, the average wait time significantly increases as the number of concurrent queries increases:
threads going up
In fact, it could be said that that nearly all worker time past 32 threads is spent waiting on memory. The final column in the chart below is the total time spent in SQL Server minus wait time for RESERVED_MEMORY_ALLOCATION_EXT. The values in that column are remarkably consistent.
running wild
In my experience, when we get into a situation with high memory waits caused by too much concurrent CCI activity all queries on the server that use a memory grant can be affected. For example, I've seen sp_whoisactive run for longer than 90 seconds.
It needs to be stated that not all CCIs will suffer from this scalability problem. I was able to achieve good scalability with some artificial tables, but all of the real target tables that I tested have excessive memory waits at high concurrency. Perhaps tables which require more CPU to compress naturally spread out their memory requests and the underlying OS is better able to keep up.
Test Results With Trace Flag 834
Microsoft strongly recommends against using trace flag 834 with columnstore tables. There's even an article dedicated to that warning. I was desperate so I tried it anyway. The difference was night and day:
trending
Enabling trace flag 834 does at least three things: SQL Server grows to max server memory on startup, AWE memory is used for memory access, and large pages are used for the buffer pool. I didn't see gains when using LPIM (which uses AWE memory) or by growing memory to max before running tests with a conventional memory model, so I suspect that the large pages are making a key difference. Wait time for RESERVED_MEMORY_ALLOCATION_EXT is under a second for all tests.
Scalability is diminished a bit for the 96 thread run. There are some wait events that creep up:
bigwaits4u
All of the wait events can be troubleshooted in conventional ways except possibly for CMEMTHREAD. There's no longer a large amount of time spent outside of SQL Server in the OS.
Other Workarounds
Without trace flag 834 this can be a difficult problem to work around. The two main strategies are to spread out CCI insert activity as much as possible during the ETL and to reduce memory usage of queries which run at the same time as the CCI inserts. For example, consider a query that inserts into a CCI that also performs a large hash join. If that hash join can be moved to somewhere else in the process then you might come out ahead in reducing contention on memory.
Other than that, there's some evidence that virtualized servers are not a good fit for this type of workload. Large virtual guests experience the memory waits at an increased rate, but it isn't yet clear if the problem can be avoided through some change in VM configuration.
Final Thoughts
It's hard not to conclude that TF 834 is necessary to get scalability for columnstore ETLs on very large servers. Hopefully Microsoft will make TF 834 compatible with columnstore one day in the future.
Thanks for reading!
Going Further
If this is the kind of SQL Server stuff you love learning about, you'll love my training. I'm offering a 75% discount to my blog readers if you click from here. I'm also available for consulting if you just don't have time for that and need to solve performance problems quickly.