Thoughts On Setting MAXDOP Correctly In SQL Server

Microsoft recently published new guidance on setting server level MAXDOP. I hope to help the community by analyzing the new guidance and offering some of my own thoughts on query parallelism.

Line by line


Documentation is meant to be shared after all, so hopefully no one minds if I quote most of it:

Starting with SQL Server 2016 (13.x), during service startup if the Database Engine detects more than eight physical cores per NUMA node or socket at startup, soft-NUMA nodes are created automatically by default. The Database Engine places logical processors from the same physical core into different soft-NUMA nodes.

This is true and one of the bigger benefits of auto soft-NUMA as far as I’ve been able to tell.

The recommendations in the table below are aimed at keeping all the worker threads of a parallel query within the same soft-NUMA node.

SQL Server is not designed to keep all worker threads in a single soft-NUMA node. That might have been true in SQL Server 2008, but it changed in 2012. The only semi-official documentation that I know of is here and I looked into the behavior here. Read through both if you’re interested in how scheduling of parallel worker threads is performed by SQL Server, but I’ll provide a quick summary via example here.

Suppose you have two soft-NUMA nodes of 6 schedulers each and the server just restarted.NUMA node 0 has positions 0-5 and NUMA node 1 has positions 6-11. The global enumerator starts at position 0. If I run a MAXDOP 4 query then the enumerator advances by 4. The parallel workers are allowed in positions 0-3 which means that any four out of six schedulers can be chosen from NUMA node 0. All parallel worker threads are in NUMA node 0 for the first query. Suppose I run another MAXDOP 4 query. The enumerator advances by 4 and the allowed positions are 4-7. That means that any two schedulers can be chosen from NUMA node 0 and any two schedulers can be chosen from NUMA node 1. The worker threads are split over two soft-NUMA nodes even though query MAXDOP is less than the size of the soft-NUMA nodes.

Unless you’re on a server with a single soft-NUMA node it is difficult to guarantee that all worker threads end up on the same soft-NUMA node. I strongly recommend against aiming for that as a goal. There are more details in the “Preventing hard NUMA worker splits” section of this blog post.

This will improve the performance of the queries and distribution of worker threads across the NUMA nodes for the workload. For more information, see Soft-NUMA.

I’ve heard some folks claim that keeping all parallel workers on a single hard NUMA nodes can be important for query performance. I’ve even seen some queries experience reduced performance when thread 0 is on a different hard NUMA node than parallel worker threads. I haven’t heard of anything about the importance of keeping all of a query’s worker threads on a single soft-NUMA node. It doesn’t really make sense to say that query performance will be improved if all worker threads are on the same soft-NUMA node. Soft-NUMA is a configuration setting. Suppose I have a 24 core hard NUMA node and my goal is to get all of a parallel query’s worker threads on a single soft-NUMA node. To accomplish that goal the best strategy is to disable auto soft-NUMA because that will give me a NUMA node size of 24 as opposed to 8. So disabling auto soft-NUMA will increase query performance?

Starting with SQL Server 2016 (13.x), use the following guidelines when you configure the max degree of parallelism server configuration value:

Server with single NUMA node [and] Less than or equal to 8 logical processors: Keep MAXDOP at or below # of logical processors

I don’t understand this guidance at all. If MAXDOP is set to above the number of logical processors then the total number of logical processors is used. This is even mentioned earlier on the same page of documentation. This line is functionally equivalent to “Set MAXDOP to whatever you want”.

Server with single NUMA node [and] Greater than 8 logical processors: Keep MAXDOP at 8

This configuration is only possible with a physical core count between 5 and 8 and with hyperthreading enabled. Setting MAXDOP above the physical core count isn’t recommended by some folks, but I suppose there could be some scenarios where it makes sense. Keeping MAXDOP at 8 isn’t bad advice for many queries on a large enough server, but the documentation is only talking about small servers here.

Server with multiple NUMA nodes [and] Less than or equal to 16 logical processors per NUMA node: Keep MAXDOP at or below # of logical processors per NUMA node

I have never seen an automatic soft-NUMA configuration result in more than 16 schedulers per soft-NUMA node, so this covers all server configurations with more than 8 physical cores. Soft-NUMA scheduler counts per node can range from 4 to 16. If you accept this advice then in some scenarios you’ll need to lower MAXDOP as you increase the number of physical cores per socket. For example, if I have 24 schedulers per socket without hyperthreading then auto soft-NUMA gives me three NUMA nodes of 8 schedulers, so I might set MAXDOP to 8. But if the scheduler count is increased to 25, 26, or 27 then I’ll have at least one soft-NUMA node of 6 schedulers. So I should lower MAXDOP from 8 to 6 because the physical core count of the socket increased?

Server with multiple NUMA nodes [and] Greater than 16 logical processors per NUMA node: Keep MAXDOP at half the number of logical processors per NUMA node with a MAX value of 16

I have never seen an automatic soft-NUMA configuration result in more than 16 schedulers per soft-NUMA node. I believe that this is impossible. At the very least, if it possible I can tell you that it’s rare. This feels like an error in the documentation. Perhaps they were going for some kind of hyperthreading adjustment?

NUMA node in the above table refers to soft-NUMA nodes automatically created by SQL Server 2016 (13.x) and higher versions.

I suspect that this is a mistake and that some “NUMA node” references are supposed to refer to hard NUMA. It’s difficult to tell.

Use these same guidelines when you set the max degree of parallelism option for Resource Governor workload groups.

There are two benefits to using MAXDOP at the Resource Governor workload group level. The first benefit is that it allows different workloads to have different MAXDOP without changing lots of application code. The guidance here doesn’t allow for that benefit. The second benefit is that it acts as a hard limit on query MAXDOP as opposed to the soft limit provided with server level MAXDOP. It may also be useful to know that the query optimizer takes server level MAXDOP into account when creating a plan. It does not do so for MAXDOP set via Resource Governor.

I haven’t seen enough different types of workloads in action to provide generic MAXDOP guidance, but I can share some of the issues that can occur with query parallelism being too low or too high.

What are some of the problems with setting MAXDOP too low?


  1. Better query performance may be achieved with a higher MAXDOP. For example, a well-written MAXDOP 8 query on a quiet server may simply run eight times as quickly as the MAXDOP 1 version. In some scenarios this is highly desired behavior.
  2. There may not be enough concurrent queries to get full value out of the server’s hardware without increasing query MAXDOP. Unused schedulers can be a problem for batch workloads that aim to get a large, fixed amount of work done as quickly as possible.
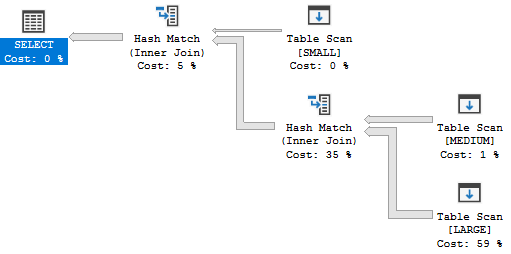
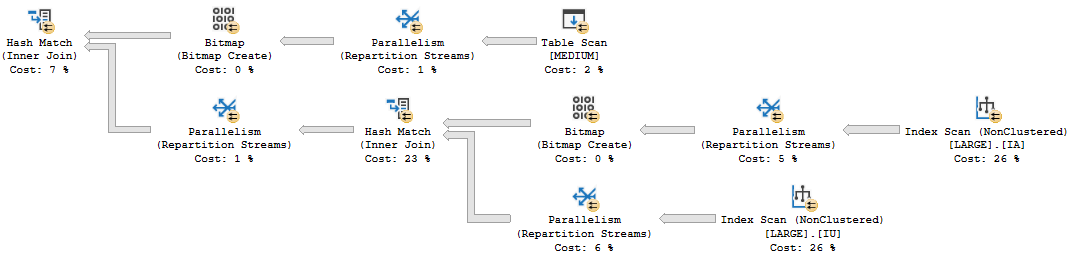
  3. Row mode bitmap operators associated with hash joins and merge joins only execute in parallel plans. MAXDOP 1 query plans lose out on this optimization.

What are some of the problems with setting MAXDOP too high?


  1. At some point, throwing more and more parallel queries at a server will only slow things down. Imagine adding more and more cars to an already gridlocked traffic situation. Depending on the workload you may not want to have many active workers per scheduler.
  2. It is possible to run out of worker threads with many concurrent parallel queries that have many parallel branches each. For example, a MAXDOP 8 query with 20 branches will ask for 160 parallel workers. When this happens parallel queries can get downgraded all the way to MAXDOP 1.
  3. Row mode exchange operators need to move rows between threads and do not scale well with increased query MAXDOP.
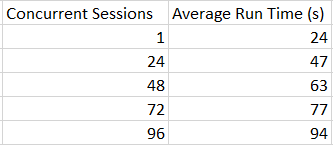
  4. Some types of row mode exchange operators evenly divide work among all parallel worker threads. This can degrade query performance if even one worker thread is on a busy scheduler. Consider a server with 8 schedulers. Scheduler 0 has two active workers and all other schedulers have no workers. Suppose there is 40 seconds of CPU work to do, the query scales with MAXDOP perfectly, and work is evenly distributed to worker threads. A MAXDOP 4 query can be expected to run in 40/4 = 10 seconds since SQL Server is likely to pick four of the seven less busy schedulers. However, a MAXDOP 8 query must put one of the worker threads on scheduler 0. The work on schedulers 1 – 7 will finish in 40/8 = 5 seconds but the worker thread on scheduler 0 has to yield to the other worker threads. It may take 5 * 3 = 15 seconds if CPU is shared evenly, so in this example increasing MAXDOP from 4 to 8 increases query run time from 10 seconds to 15 seconds.
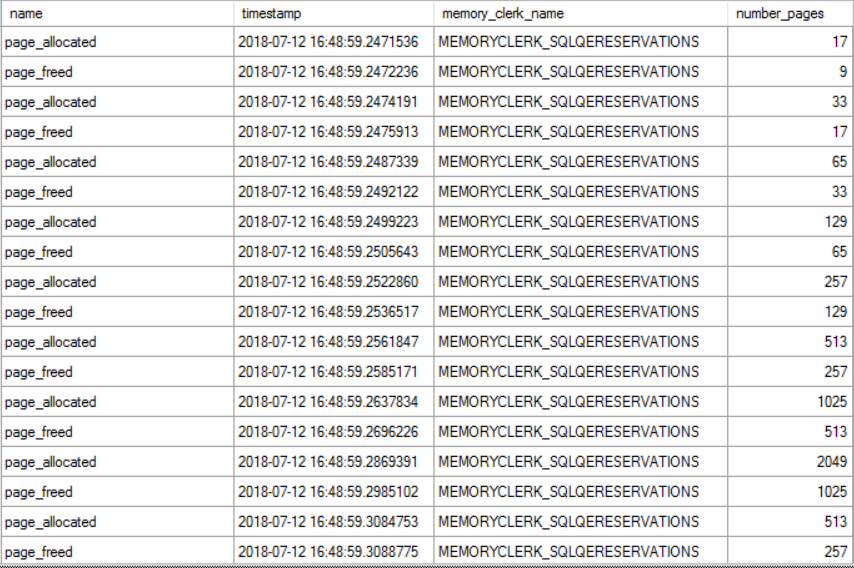
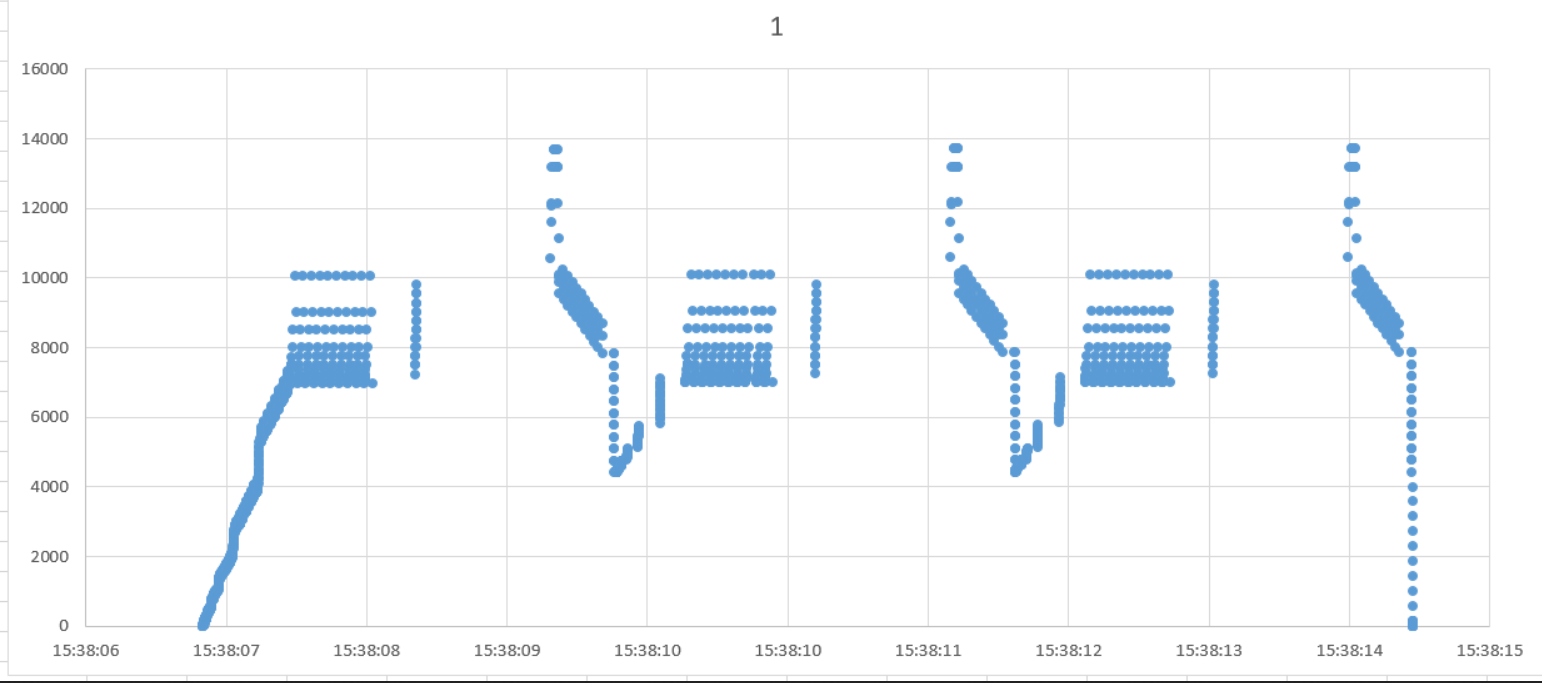
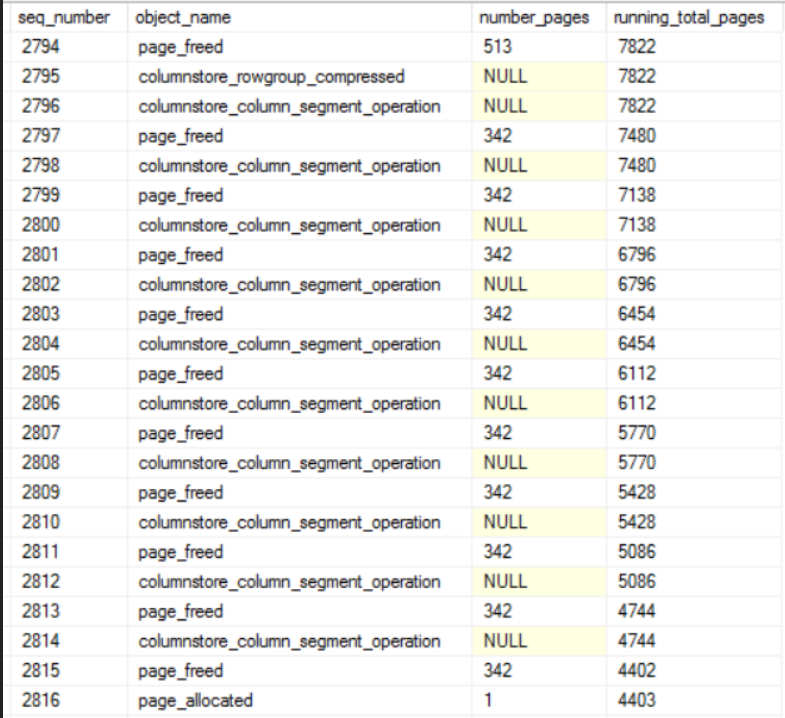
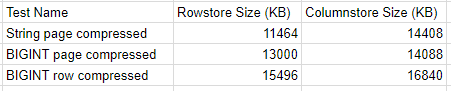
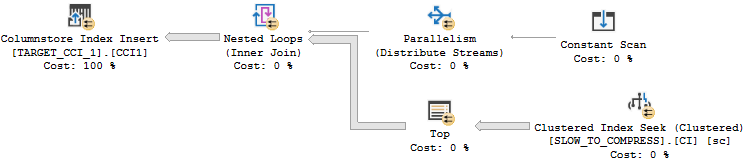
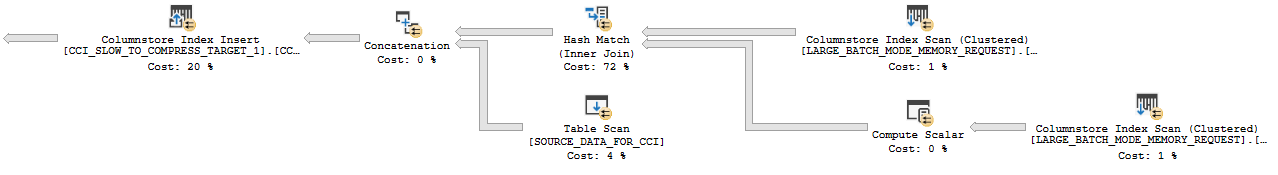
  5. The query memory grant for parallel inserts into columnstore indexes increases with MAXDOP. If MAXDOP is too high then memory pressure can occur during compression and the SELECT part of the query may be starved for memory.
  6. The query memory grant for memory-consuming operators on the inner side of a nested loop is often not increased with MAXDOP even though the operator may execute concurrently once on each worker thread. In some uncommon query patterns, increasing MAXDOP will increase the amount of data spilled to tempdb.
  7. Increasing MAXDOP increases the number of queries that will have parallel workers spread across multiple hard NUMA nodes. If MAXDOP is greater than the number of schedulers in a hard NUMA node then the query is guaranteed to have split workers. This can degrade query performance for some types of queries.
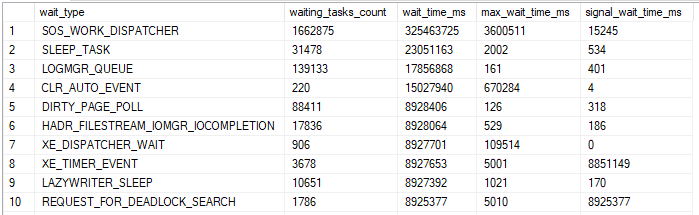
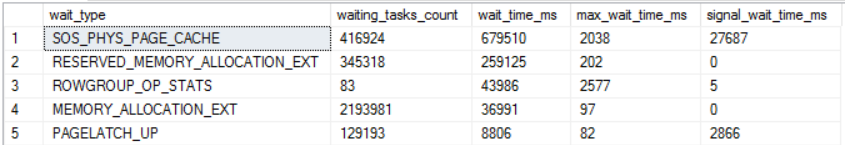
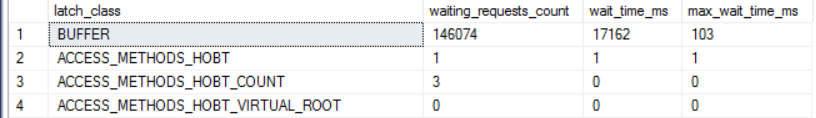
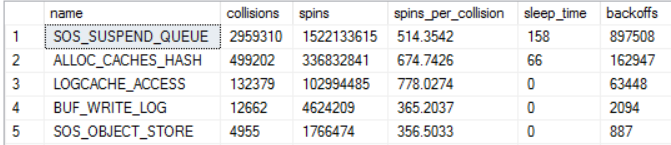
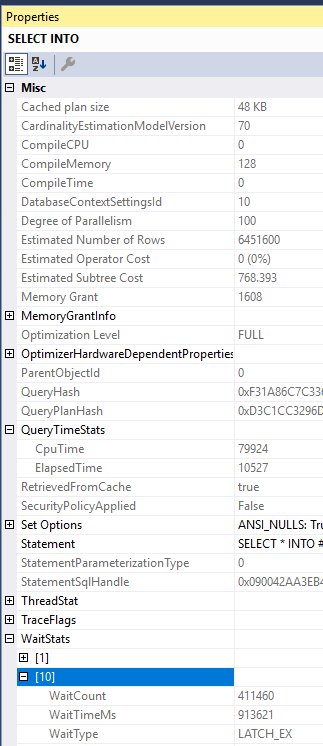
  8. Worker threads may need to wait on some type of shared resource. Increasing MAXDOP can increase contention without improving query performance. For example, there’s nothing stopping me from running a MAXDOP 100 SELECT INTO, but I certainly do not get 100X of the performance of a MAXDOP 1 query. The problem with the below query is the NESTING_TRANSACTION_FULL latch:

SQL Server Query Plan Properties

Preventing hard NUMA worker splits


It generally isn’t possible to prevent worker splits over hard NUMA nodes without changing more than server level and query level MAXDOP. Consider a server with 2 hard NUMA nodes of 10 schedulers for each. To avoid a worker split, an administrator might try setting server level MAXDOP to 10, with the idea being that each parallel query spreads its workers over NUMA node 0 or NUMA node 1. This plan won’t work if any of the following occur:

  • Any query runs with a query level MAXDOP hint other than 0, 1, 10, or 20.
  • Any query is downgraded in MAXDOP but still runs in parallel.
  • A parallel stats update happens. The last time I checked these run with a query level MAXDOP hint of 16.
  • Something else unexpected happens.

In all cases the enumerator will be shifted and any MAXDOP 10 queries that run after will split their workers. TF 2467 can help, but it needs to be carefully tested with the workload. With the trace flag, as long as MAXDOP <= 10 and automatic soft-NUMA is disabled then the parallel workers will be sent to a single NUMA node based on load. Note that execution context 0 thread can still be on a different hard NUMA node. If you want to prevent that then you can try Resource Governor CPU affinity at the Resource Pool level. Create one pool for NUMA node 0 and one pool for NUMA node 1. You may experience interesting consequences when doing that.

The most reliable method by far is to have a single hard NUMA node, so if you have a VM that fits into a single socket of a VM host and you care about performance then ask your friendly VM administrator for some special treatment.

Final thoughts


I acknowledge that it’s difficult to create MAXDOP guidance that works for all scenarios and I hope that Microsoft continues to try to improve their documentation on the subject. Thanks for reading!

SQL Server T-SQL Protip: watch those TOPs without ORDER BY

In the documentation for TOP, the following is listed as a best practice:

In a SELECT statement, always use an ORDER BY clause with the TOP clause. Because, it’s the only way to predictably indicate which rows are affected by TOP.

Let’s work through a real world example.

The good


One of the great things about the “Top Resource Consuming Queries” query store SSMS report is that it is always able to render the query plan, even for very complex queries. I’m not aware of a pure T-SQL solution that can avoid requiring the end user to save xml to files in all cases. The report nearly always takes a long time to run, so it’s easy to capture the T-SQL that powers the grid details version:

DECLARE @results_row_count INT = 100,
@interval_start_time DATETIMEOFFSET = '2019-05-24 15:30:00 +00:00',
@interval_end_time DATETIMEOFFSET = '2019-05-24 18:00:00 +00:00';
 
SELECT TOP (@results_row_count)
    p.query_id query_id,
    q.object_id object_id,
    ISNULL(OBJECT_NAME(q.object_id),'') object_name,
    qt.query_sql_text query_sql_text,
    ROUND(CONVERT(float, SUM(rs.avg_duration*rs.count_executions))*0.001,2) total_duration,
    SUM(rs.count_executions) count_executions,
    COUNT(distinct p.plan_id) num_plans
FROM sys.query_store_runtime_stats rs
    JOIN sys.query_store_plan p ON p.plan_id = rs.plan_id
    JOIN sys.query_store_query q ON q.query_id = p.query_id
    JOIN sys.query_store_query_text qt ON q.query_text_id = qt.query_text_id
WHERE NOT (rs.first_execution_time > @interval_end_time OR rs.last_execution_time < @interval_start_time)
GROUP BY p.query_id, qt.query_sql_text, q.object_id
HAVING COUNT(distinct p.plan_id) >= 1
ORDER BY total_duration DESC;

Note the presence of the ORDER BY. I get exactly the results that I was expecting:

The bad


If I ask for extra details (who doesn’t want more details?), a significantly more complex query is generated:

-- grid format query with additional details
DECLARE @results_row_count INT = 100,
@interval_start_time DATETIMEOFFSET = '2019-05-24 15:30:00 +00:00',
@interval_end_time DATETIMEOFFSET = '2019-05-24 18:00:00 +00:00';
 
With wait_stats AS
(
SELECT
    ws.plan_id plan_id,
    ws.execution_type,
    ROUND(CONVERT(float, SUM(ws.total_query_wait_time_ms)/SUM(ws.total_query_wait_time_ms/ws.avg_query_wait_time_ms))*1,2) avg_query_wait_time,
    ROUND(CONVERT(float, SQRT( SUM(ws.stdev_query_wait_time_ms*ws.stdev_query_wait_time_ms*(ws.total_query_wait_time_ms/ws.avg_query_wait_time_ms))/SUM(ws.total_query_wait_time_ms/ws.avg_query_wait_time_ms)))*1,2) stdev_query_wait_time,
    CAST(ROUND(SUM(ws.total_query_wait_time_ms/ws.avg_query_wait_time_ms),0) AS BIGINT) count_executions,
    MAX(itvl.end_time) last_execution_time,
    MIN(itvl.start_time) first_execution_time
FROM sys.query_store_wait_stats ws
    JOIN sys.query_store_runtime_stats_interval itvl ON itvl.runtime_stats_interval_id = ws.runtime_stats_interval_id
WHERE NOT (itvl.start_time > @interval_end_time OR itvl.end_time < @interval_start_time)
GROUP BY ws.plan_id, ws.runtime_stats_interval_id, ws.execution_type ),
top_wait_stats AS
(
SELECT TOP (@results_row_count)
    p.query_id query_id,
    q.object_id object_id,
    ISNULL(OBJECT_NAME(q.object_id),'') object_name,
    qt.query_sql_text query_sql_text,
    ROUND(CONVERT(float, SUM(ws.avg_query_wait_time*ws.count_executions))*1,2) total_query_wait_time,
    SUM(ws.count_executions) count_executions,
    COUNT(distinct p.plan_id) num_plans
FROM wait_stats ws
    JOIN sys.query_store_plan p ON p.plan_id = ws.plan_id
    JOIN sys.query_store_query q ON q.query_id = p.query_id
    JOIN sys.query_store_query_text qt ON q.query_text_id = qt.query_text_id
WHERE NOT (ws.first_execution_time > @interval_end_time OR ws.last_execution_time < @interval_start_time)
GROUP BY p.query_id, qt.query_sql_text, q.object_id
),
top_other_stats AS
(
SELECT TOP (@results_row_count)
    p.query_id query_id,
    q.object_id object_id,
    ISNULL(OBJECT_NAME(q.object_id),'') object_name,
    qt.query_sql_text query_sql_text,
    ROUND(CONVERT(float, SUM(rs.avg_duration*rs.count_executions))*0.001,2) total_duration,
    ROUND(CONVERT(float, SUM(rs.avg_cpu_time*rs.count_executions))*0.001,2) total_cpu_time,
    ROUND(CONVERT(float, SUM(rs.avg_logical_io_reads*rs.count_executions))*8,2) total_logical_io_reads,
    ROUND(CONVERT(float, SUM(rs.avg_logical_io_writes*rs.count_executions))*8,2) total_logical_io_writes,
    ROUND(CONVERT(float, SUM(rs.avg_physical_io_reads*rs.count_executions))*8,2) total_physical_io_reads,
    ROUND(CONVERT(float, SUM(rs.avg_clr_time*rs.count_executions))*0.001,2) total_clr_time,
    ROUND(CONVERT(float, SUM(rs.avg_dop*rs.count_executions))*1,0) total_dop,
    ROUND(CONVERT(float, SUM(rs.avg_query_max_used_memory*rs.count_executions))*8,2) total_query_max_used_memory,
    ROUND(CONVERT(float, SUM(rs.avg_rowcount*rs.count_executions))*1,0) total_rowcount,
    ROUND(CONVERT(float, SUM(rs.avg_log_bytes_used*rs.count_executions))*0.0009765625,2) total_log_bytes_used,
    ROUND(CONVERT(float, SUM(rs.avg_tempdb_space_used*rs.count_executions))*8,2) total_tempdb_space_used,
    SUM(rs.count_executions) count_executions,
    COUNT(distinct p.plan_id) num_plans
FROM sys.query_store_runtime_stats rs
    JOIN sys.query_store_plan p ON p.plan_id = rs.plan_id
    JOIN sys.query_store_query q ON q.query_id = p.query_id
    JOIN sys.query_store_query_text qt ON q.query_text_id = qt.query_text_id
WHERE NOT (rs.first_execution_time > @interval_end_time OR rs.last_execution_time < @interval_start_time)
GROUP BY p.query_id, qt.query_sql_text, q.object_id
)
SELECT TOP (@results_row_count)
    A.query_id query_id,
    A.object_id object_id,
    A.object_name object_name,
    A.query_sql_text query_sql_text,
    A.total_duration total_duration,
    A.total_cpu_time total_cpu_time,
    A.total_logical_io_reads total_logical_io_reads,
    A.total_logical_io_writes total_logical_io_writes,
    A.total_physical_io_reads total_physical_io_reads,
    A.total_clr_time total_clr_time,
    A.total_dop total_dop,
    A.total_query_max_used_memory total_query_max_used_memory,
    A.total_rowcount total_rowcount,
    A.total_log_bytes_used total_log_bytes_used,
    A.total_tempdb_space_used total_tempdb_space_used,
    ISNULL(B.total_query_wait_time,0) total_query_wait_time,
    A.count_executions count_executions,
    A.num_plans num_plans
FROM top_other_stats A LEFT JOIN top_wait_stats B on A.query_id = B.query_id and A.query_sql_text = B.query_sql_text and A.object_id = B.object_id
WHERE A.num_plans >= 1
ORDER BY total_duration DESC
)

Now we have not 1, not 2, but THREE TOP operators! But only one of them has an ORDER BY. The results are completely different, and are pretty much useless:

The ugly


This has nothing to do with TOP as far as I know, but I included it just for fun:

Final thoughts


All of you developers out there should watch your TOPs and make sure you’re using ORDER BY as needed. Otherwise, you might end up with annoyed end users writing blog posts about your code.

Thanks for reading!

Going Further


If this is the kind of SQL Server stuff you love learning about, you’ll love my training. I’m offering a 75% discount to my blog readers if you click from here. I’m also available for consulting if you just don’t have time for that and need to solve performance problems quickly.

Why is SYSDATETIME() slower than SYSUTCDATETIME() In SQL Server?

Consider the following code that calls SYSDATETIME() 10 million times in a loop:

GO

CREATE OR ALTER PROCEDURE #p_local AS
BEGIN
	SET NOCOUNT ON;

	DECLARE @dummy DATETIME2(7), @loops INT = 0;

	WHILE @loops <= 10000000
	BEGIN
		SET @dummy = SYSDATETIME();

		SET @loops = @loops + 1;
	END;
END;

GO

EXEC #p_local;

On my machine the code takes about 11.6 seconds to execute. Replacing SYSDATETIME() with SYSUTCDATETIME() makes the code take only 4.3 seconds to execute. Why is SYSUTCDATETIME() so much faster than SYSDATETIME()?

It’s always a CPU problem


Both while loops drive a CPU core to 100% while executing. Within SQL server, elapsed time nearly equals CPU. For this code, I wouldn’t expect waits, latches, or spinlocks to reveal any clues. Query plans, execution stats, and other DMVs are unlikely to help as well. One thing that could help is information about the internals of SYSDATETIME() and SYSUTCDATETIME(). There’s a little bit on books online:

SQL Server obtains the date and time values by using the GetSystemTimeAsFileTime() Windows API. The accuracy depends on the computer hardware and version of Windows on which the instance of SQL Server is running. The precision of this API is fixed at 100 nanoseconds. The accuracy can be determined by using the GetSystemTimeAdjustment() Windows API.

Probably all of the useful information is likely locked behind the vault at Microsoft. Fortunately, both SQL Server and the guest OS are happy to give us information about what SQL Server is using its CPU to do if we have the right public symbols and ask nicely. I know of four primary ways of doing this:

  1. A True Professional could use WinDbg (the cool kids pronounce it “wind bag”) or another debugger to step through the code of both functions. I don’t have the skills or patience to do that.
  2. DBCC STACKDUMP or sqldumper.exe can be used to create a filtered memory dump on demand. The problem with this approach is that it only provides a single snapshot and our functions execute very quickly.
  3. Extended events can provide callstacks for many events. I’m not aware of an extended event that would fire at the right times for this code.
  4. ETW tracing can provide a summary of call stacks during a sampled time period. Common choices are Windows Performance Recorder or PerfView.

Option 4 is exactly what we need. We can run a single query at a time that performs uniform work and we want to see where CPU time is spent during the entire query’s execution. My tool of choice is PerfView.

Revealing SQL Server’s secrets


I used PerfView’s default settings and collected ETW profile data separately during both while loops. After resolving symbols and changing folding to 0, there’s a clear difference between SYSDATETIME() (on the left) and SYSUTCDATETIME() (on the right):

kernelbase!GetTimeZoneInformation shows up with a high percentage for exclusive time for SYSDATETIME(). It does not show up at all for SYSUTCDATETIME(). In case it helps, here’s documention for a few of the column names:

Exc – The amount of cost (msec of CPU time) that can be attributed to the particular method itself (not any of its callees)
Exc % – The exclusive cost expressed as a percentage of the total cost of all samples.
Inc – The cost associated with this node as well as all its children (callees) recursively. The inclusive cost of the ROOT contains all costs.
Inc % – The inclusive cost expressed as a percentage of the total cost of all samples (will be 100% for the ROOT node)

sqltses!CXVariant::GetSysDatetime sounds an awful lot like SYSDATETIME() to me. It also shows up in the right place in the stack to be a match. Drilling into the methods are called by it:

Note that the call to kernelbase!GetTimeZoneInformation takes up nearly all CPU time. There’s also a call to kernelbase!GetSystemTimeAsFileTime that barely shows up as well.

Sharp-eyed readers might be wondering if SYSDATETIMEOFFSET() results in calls to sqltses!CDatetimeOffset::SetSystemDatetimeOffset. The answer is yes, but this is left as an exercise for the reader.

Again, sqltses!CXVariant::GetSysUTCDatetime sounds like awful lot like SYSUTCDATETIME() to me. Drilling into the methods are called by it:

Note the low percentage of inclusive time for the call. SYSUTCDATETIME() is so cheap to call that most of the CPU time is spent executing the loop code instead of that function. kernelbase!GetTimeZoneInformation does not show up at all. There’s is still a call to kernelbase!GetSystemTimeAsFileTime that barely shows up.

This is probably an oversimplification, but I think it’s fair to say that each call to SYSDATETIME() needs to get time zone information. This results in a call to kernelbase!GetTimeZoneInformation that is relatively expensive. There is no need to call that method for SYSUTCDATETIME().

Does this matter? It depends™


Database folks like answering questions with “it depends”. Regrettably, they don’t always provide sufficient or accurate details about what it depends on. I strive to not fall into that trap. For many queries the performance difference between the two functions won’t matter. Consider the following two batches:

DROP TABLE IF EXISTS #BENCHMARK_TIME_FUNCTIONS;

CREATE TABLE #BENCHMARK_TIME_FUNCTIONS (SAVED_DATETIME DATETIME2(7) NULL);

INSERT INTO #BENCHMARK_TIME_FUNCTIONS WITH (TABLOCK)
SELECT TOP (10000000) SYSDATETIME()
FROM master..spt_values t1
CROSS JOIN master..spt_values t2
CROSS JOIN master..spt_values t3
OPTION (MAXDOP 1);

GO

DROP TABLE IF EXISTS #BENCHMARK_TIME_FUNCTIONS;

CREATE TABLE #BENCHMARK_TIME_FUNCTIONS (SAVED_DATETIME DATETIME2(7) NULL);

INSERT INTO #BENCHMARK_TIME_FUNCTIONS WITH (TABLOCK)
SELECT TOP (10000000) SYSUTCDATETIME()
FROM master..spt_values t1
CROSS JOIN master..spt_values t2
CROSS JOIN master..spt_values t3
OPTION (MAXDOP 1);

SQL Server doesn’t need to execute the datetime functions once per row. If it did, we’d expect a run time difference of about 7 seconds between the two queries. Instead, they execute in nearly exactly the same amount of time. I think that the details about guarantees of this behavior were found on a Connect (RIP) comment.

The performance difference can make a difference when the function is used to profile code that executes row by row. Suppose that we have related SQL statements and we want to measure the execution time of just one of the statements by calculating the time difference before and after execution. I’m not saying that this is the best way of doing this analysis, but I suspect it to be a common technique. Below is an example stored procedure with one copy using SYSDATETIME() and the other using SYSUTCDATETIME():

GO

CREATE OR ALTER PROCEDURE #USE_SUPERIOR_AMERICAN_TIME AS
BEGIN
	DECLARE @start_time DATETIME2(7),
	@end_time DATETIME2(7),
	@total_microseconds BIGINT = 0,
	@loops INT = 0;

	SET NOCOUNT ON;

	DROP TABLE IF EXISTS dbo.OFFICIAL_STATEMENTS;
	CREATE TABLE dbo.OFFICIAL_STATEMENTS (OFFICIAL_STATEMENT VARCHAR(30));
	
	WHILE @loops <= 50000 BEGIN INSERT INTO dbo.OFFICIAL_STATEMENTS VALUES ('NO COLLUSION');
		IF @@ROWCOUNT > 0	
		BEGIN
			SET @start_time = SYSDATETIME();

			INSERT INTO dbo.OFFICIAL_STATEMENTS VALUES ('NO OBSTRUCTION');

			SET @end_time = SYSDATETIME();

			SET @total_microseconds = @total_microseconds + DATEDIFF(MICROSECOND, @start_time, @end_time);
		END;

		SET @loops = @loops + 1;
	END;

	SELECT @total_microseconds;
END;

GO

EXEC #USE_SUPERIOR_AMERICAN_TIME;

GO

CREATE OR ALTER PROCEDURE #USE_INFERIOR_EUROPEAN_TIME AS
BEGIN
	DECLARE @start_time DATETIME2(7),
	@end_time DATETIME2(7),
	@total_microseconds BIGINT = 0,
	@loops INT = 0;

	SET NOCOUNT ON;

	DROP TABLE IF EXISTS dbo.OFFICIAL_STATEMENTS;
	CREATE TABLE dbo.OFFICIAL_STATEMENTS (OFFICIAL_STATEMENT VARCHAR(30));
	
	WHILE @loops <= 50000 BEGIN INSERT INTO dbo.OFFICIAL_STATEMENTS VALUES ('NO COLLUSION');
		IF @@ROWCOUNT > 0	
		BEGIN
			SET @start_time = SYSUTCDATETIME();

			INSERT INTO dbo.OFFICIAL_STATEMENTS VALUES ('NO OBSTRUCTION');

			SET @end_time = SYSUTCDATETIME();

			SET @total_microseconds = @total_microseconds + DATEDIFF(MICROSECOND, @start_time, @end_time);
		END;

		SET @loops = @loops + 1;
	END;

	SELECT @total_microseconds;
END;

GO

EXEC #USE_INFERIOR_EUROPEAN_TIME;

The second insert query takes a total of 4381219 microseconds with SYSDATETIME() and 4164658 microseconds with SYSUTCDATETIME(). That’s a 5% difference just from changing the datetime function. Of course, given that this code is measuring the difference of times SYSUTCDATETIME() is the correct choice because it remains accurate even if there’s a daylight savings switch during code execution. My own approach is trying to avoid running one-off stored procedures around 2:00 AM.

Final thoughts


There’s a large performance difference between SYSDATETIME() and SYSUTCDATETIME(). It isn’t necessary to guess which one is slower and why. ETW tracing tools such as PerfView can reveal exactly where the performance difference comes from. Thanks for reading!

Breaking Columnstore Delta Rowgroups

The documentation on delta rowgroups says:

A delta rowgroup is a clustered index that’s used only with columnstore indexes. It improves columnstore compression and performance by storing rows until the number of rows reaches a threshold and are then moved into the columnstore.

This clustered index isn’t chosen by the person who creates the table. It’s a hidden internal column automatically added to delta rowgroups. Perhaps the implementation is similar to that of table spools:

The worktable is structured as if it was defined with a clustered index on zero columns. This means that a 4-byte uniqueifier is added to each row stored except the first.

You know how programmers are: they love reusing old code. If a similar implementation is used for delta rowgroups then it should be possible to see SQL Server errors with the right pattern of data loading. More investigation is required.

Defining the rules


It might be possible to find evidence of this clustered index by using DBCC PAGE. In the T-SQL code below, I create a table clustered columnstore index, insert 500 rows, delete 499 rows, insert 500 more rows, and delete 499 rows again:

CREATE TYPE dbo.SEAN_GALLARDY_INT FROM SMALLINT NOT NULL;

DROP TABLE IF EXISTS dbo.view_hidden_clustered_index;

CREATE TABLE dbo.view_hidden_clustered_index (
	ID SEAN_GALLARDY_INT,
	INDEX CCI CLUSTERED COLUMNSTORE
);

GO

CREATE OR ALTER PROCEDURE #p AS
BEGIN
	SET NOCOUNT ON;

	DECLARE @value_to_insert INT = 1;

	WHILE @value_to_insert <= 500
	BEGIN
		INSERT INTO dbo.view_hidden_clustered_index VALUES (@value_to_insert);

		SET @value_to_insert = @value_to_insert + 1;
	END;

	DELETE FROM dbo.view_hidden_clustered_index
	WHERE ID < 500;

	WHILE @value_to_insert <= 1000
	BEGIN
		INSERT INTO dbo.view_hidden_clustered_index VALUES (@value_to_insert);

		SET @value_to_insert = @value_to_insert + 1;
	END;

	DELETE FROM dbo.view_hidden_clustered_index
	WHERE ID > 500 AND ID < 1000;
END;

GO

EXEC #p;

There’s only a single page that stores the 2 rows currently held by the table. This can be viewed with the undocumented DBCC PAGE, TF 3604, and the undocumented sys.dm_db_database_page_allocations:

DECLARE @file_id SEAN_GALLARDY_INT;
DECLARE @page_id INT;

SELECT @file_id = allocated_page_file_id, @page_id = allocated_page_page_id
FROM sys.dm_db_database_page_allocations 
    (DB_ID(), OBJECT_ID('dbo.view_hidden_clustered_index'),NULL, NULL, 'DETAILED')
WHERE is_allocated = 1 AND allocation_unit_type = 1 AND is_iam_page = 0 and page_type = 1;

DBCC TRACEON(3604);
DBCC PAGE('TEST',@file_id,@page_id,3) WITH TABLERESULTS;
DBCC TRACEOFF(3604);

The information that we’re looking for is near the bottom of the result set:

A few things are worth calling out. The 500th row that was inserted into the table has a value of 499 for the “CSILOCATOR” field. This value appears to be stored in little-endian format in the memory dump for Slot 0 Offset 0x60. You can decode the raw value to 499 in T-SQL if desired:

SELECT CAST(0x000001F3 AS INT);

The 1000th row that was inserted into the table into the table has a value of 999 for the CSILOCATOR field. Most importantly, this CSILOCATOR field has a length of four bytes. A typical four byte int in SQL Server has a maximum value of 2147483647. If it’s possible to load billions of rows into a single delta rowgroup then we may run out of values for the CSILOCATOR field.

Of course, a single delta rowgroup cannot hold more than 1048576 rows. As you can see in this example, SQL Server does not always reuse freed up values for the CSILOCATOR field. The table currently has two rows, yet the field has advanced to 999. The right pattern of deletes, inserts, and updates should allow the CSILOCATOR to continue to grow without running out of room for rows in the delta rowgroup.

As a final note, I cannot prove that the CSILOCATOR field corresponds to the clustered index, but it certainly seems to serve the function of a uniqueifier that would be needed for said clustered index.

Running up the score


I need to find a relatively efficient way to advance the CSILOCATOR because I need to do it over 2 billion times, if my theory is correct about the maximum allowed value. Both updating all of the rows in a delta rowgroup and deleting and reinserting advance the CSILOCATOR. I expected that small batch sizes would work best, and they did. For my table’s schema, the sweet spot for updates is about 275 rows and the sweet spot for delete/inserts is about 550 rows. Delete/inserts appeared to be faster than updates for the purpose of constantly reloading the same rows over and over.

Strategies that use multiple CPU cores are possible, but I wanted to do other work on this PC and didn’t want to listen to a loud fan all day. Here’s what the final testing code looked like:

DROP TABLE IF EXISTS dbo.delta_store_test;

CREATE TABLE dbo.delta_store_test (
	ID TINYINT NOT NULL,
	INDEX CCI CLUSTERED COLUMNSTORE
);


DROP TABLE IF EXISTS dbo.LOG_TABLE;

CREATE TABLE dbo.LOG_TABLE (
	log_time DATETIME,
	loop_count INT,
	PRIMARY KEY (log_time)
);

GO

DROP TABLE IF EXISTS dbo.delta_store_source;
CREATE TABLE dbo.delta_store_source (
	ID TINYINT NOT NULL
);

INSERT INTO dbo.delta_store_source
SELECT TOP (550) 1
FROM master..spt_values t1
OPTION (MAXDOP 1);

GO

CREATE OR ALTER PROCEDURE #p AS
BEGIN
	SET NOCOUNT ON;

	DECLARE @loops INT = 0;

	WHILE @loops <= 8000000
	BEGIN
		DELETE FROM dbo.delta_store_test

		INSERT INTO dbo.delta_store_test
		SELECT 1
		FROM dbo.delta_store_source WITH (TABLOCK);

		SET @loops = @loops + 1;

		IF @loops % 10000 = 0
		BEGIN
			INSERT INTO dbo.LOG_TABLE
			VALUES (GETDATE(), @loops);
		END;
	END;
END;

GO

EXEC #p;

If you’re wondering about the temporary stored procedure creation, it’s a habit that I’ve gotten into whenever I write a T-SQL while loop. While not applicable here, very fast loops can incur ASYNC_NETWORK_IO overhead due to the passing of DONE tokens to the client.

Winning the game


After about seven hours the code reaches its glorious end:

Msg 666, Level 16, State 2, Procedure #p, Line 11 [Batch Start Line 26]
The maximum system-generated unique value for a duplicate group was exceeded for index with partition ID 72057596406595584. Dropping and re-creating the index may resolve this; otherwise, use another clustering key.

I loaded a few more rows into the table until I was unable to insert even one row. Using DBCC PAGE and friends again, we can see that the CSILOCATOR has a very large value of 2147483646.

Issuing a REBUILD does resolve the issue because it wipes away our sins, as REBUILDs often do. Naturally using another clustering key is not an option.

Joe: 1

Microsoft: 0

The cost of playing


My desktop computer has an intel core i5-4670 processor. Intel claims a TDP of 84 watts. Using CPUID HWMonitor, it looks like my CPU uses about 15 W of additional power when running the workload. It’s a single core workload, so I feel that 15 W is reasonable. 15 watts is 0.015 kW, and when used over 7 hours it translates to 0.105 kWh. My last electric bill has a rate of $0.11663 per kWh, so the total cost of this test comes out to about 1.2 cents. I will be sending Erik an invoice.

Final thoughts


It is possible to hit error 666 when maliciously loading data into a columnstore index. It requires loading over 2 billion rows into the same delta rowgroup, so it’s difficult to think of a production scenario that would lead to this outcome. For those of you with eccentric workloads that give cause for concern, you can roughly check if you are running of IDs by running a query similar to the following for each columnstore table:

SELECT 2147483647 - 1 - MAX(CAST(SUBSTRING(%%physloc%%, 5, 4) AS INT)) REMAINING_CSILOCATORS
FROM dbo.delta_store_test;

Thanks for reading!

SQL Server 2017 CU14 Change to CCI Insert Memory Time-out Behavior

A KB article was recently published that suggested that memory time-out behavior was changed for CCI inserts:

When you try to create a Columnstore Index on a table in Microsoft SQL Server 2016 or 2017, the request may fail after 25 seconds with memory time-out error 8645, depending on how many memory consuming queries are running concurrently and/or how much memory is available at the time of the request. The memory time-out error may occur even when you configure longer memory request time-out at an instance level or at a resource pool level.

I’ve never seen that error occur for serial inserts. Serial inserts time out after 25 seconds and execute with minimum required memory. They write directly to the delta store instead of attempting compression. So it looked like this change affects parallel inserts but the details weren’t at all clear to me.

Time out for time-outs


Why should we care about memory grant timeouts for CCI insert queries? Simply put, lots of bad things can happen when those queries can time out, both for serial and for parallel inserts. For serial insert queries, I’ve observed deadlocks, extremely poor performance along with long SLEEP_TASK waits, and extremely long rollbacks. For parallel insert queries, I’ve observed queries that run seemingly forever, poor performance of the SELECT part, and error 8645. You probably don’t want any of that occurring in production. It would be very helpful if it was possible to extend the 25 second time-out for queries that insert into columnstore tables.

Time out for time-outs


I’ve found it extremely useful to keep around a 2017 RTM environment with no CUs to figure when issues related to columnstore were introduced into the product. First we’ll take a look at the behavior on 2017 RTM to see error 8645 in action. I want a relatively simple parallel insert query that will run for longer than 25 seconds and will take a large memory grant. I decided on the following query:

INSERT INTO dbo.TARGET_CCI_1 WITH (TABLOCK)
SELECT ca.SLOW, ca.INFLATE_GRANT
FROM (VALUES (0), (1), (2), (3)) v(x)
CROSS APPLY (
	SELECT TOP (1048576) sc.SLOW, sc.INFLATE_GRANT
	FROM dbo.SLOW_TO_COMPRESS sc
	WHERE sc.FOR_SEEKING = v.x
) ca
OPTION (MAXDOP 2);

I get the properties that I’m after with a few undocumented tricks. The inflate grant column is a VARCHAR(8000) column. That data type significantly increases the memory grant for parallel inserts even with all NULLs. For the SLOW column, I’m loading integers evenly distributed between 0 and 7999. That data pattern can take longer than expected to compress. The worst case is with around 16000 distinct evenly distributed integers. If you’d like to understand why check out this answer by Paul White. Finally, the CROSS APPLY pattern means that I’ll get demand-based parallelism with each nested loop execution reading exactly enough rows from SLOW_TO_COMPRESS to fill up one rowgroup. It may be helpful to look at the query plan:

a38_query_plan

The query takes about 40 seconds to execute on my machine. If you’d like to follow along at home, set max server memory to 8000 MB and run the following code:

DROP TABLE IF EXISTS dbo.SLOW_TO_COMPRESS;

CREATE TABLE dbo.SLOW_TO_COMPRESS (
	FOR_SEEKING INT NULL,
	SLOW BIGINT NULL,
	INFLATE_GRANT VARCHAR(8000) NULL
);

CREATE CLUSTERED INDEX CI ON dbo.SLOW_TO_COMPRESS
(FOR_SEEKING);

INSERT INTO dbo.SLOW_TO_COMPRESS WITH (TABLOCK)
SELECT q.RN / 1048576, RN % 10000, NULL
FROM
(
	SELECT TOP (4 * 1048576) -1 + ROW_NUMBER()
		OVER (ORDER BY (SELECT NULL)) RN
	FROM master..spt_values t1
	CROSS JOIN master..spt_values t2
) q
OPTION (MAXDOP 1);

GO

DECLARE @table_id INT = 1,
@sql NVARCHAR(4000);

WHILE @table_id <= 6
BEGIN
	SET @sql = N'DROP TABLE IF EXISTS dbo.TARGET_CCI_'
	 + CAST(@table_id AS NVARCHAR(2))
	 + N'; CREATE TABLE dbo.TARGET_CCI_'
	 + CAST(@table_id AS NVARCHAR(2))
	 + N'(
		SLOW BIGINT NULL,
		INFLATE_GRANT VARCHAR(8000) NULL,
		INDEX CCI1 CLUSTERED COLUMNSTORE
	)';

	EXEC sp_executesql @sql;

	SET @table_id = @table_id + 1;
END;

GO

CREATE OR ALTER PROCEDURE dbo.INSERT_INTO_TARGET_CCI
(@table_id INT)
AS
BEGIN

DECLARE @sql NVARCHAR(4000) = N'INSERT INTO dbo.TARGET_CCI_'
+ CAST(@table_id AS NVARCHAR(2))
+ N' WITH (TABLOCK)
SELECT ca.SLOW, ca.INFLATE_GRANT
FROM (VALUES (0), (1), (2), (3)) v(x)
CROSS APPLY (
	SELECT TOP (1048576) sc.SLOW, sc.INFLATE_GRANT
	FROM SLOW_TO_COMPRESS sc
	WHERE sc.FOR_SEEKING = v.x
) ca
OPTION (MAXDOP 2)';

EXEC sp_executesql @sql;

END;

Error code 8645


Batch files that call sqlcmd are a convenient way to kick off lots of queries. For example:

START /B sqlcmd -d TEST -S .\SQL2017RTM -Q "EXEC dbo.INSERT_INTO_TARGET_CCI 1;" > nul
START /B sqlcmd -d TEST -S .\SQL2017RTM -Q "EXEC dbo.INSERT_INTO_TARGET_CCI 2;" > nul
START /B sqlcmd -d TEST -S .\SQL2017RTM -Q "EXEC dbo.INSERT_INTO_TARGET_CCI 3;" > nul
START /B sqlcmd -d TEST -S .\SQL2017RTM -Q "EXEC dbo.INSERT_INTO_TARGET_CCI 4;" > nul
START /B sqlcmd -d TEST -S .\SQL2017RTM -Q "EXEC dbo.INSERT_INTO_TARGET_CCI 5;" > nul

Note that I do not have Resource Governor enabled. If I kick off five queries at once using the batch file I don’t get an error. After 25 seconds two of the five queries are able to execute with the same memory grant as others:

a38_memory_grant_RTM

It does make me uncomfortable to see query memory grants exceed the target memory for the semaphore by so much, but at least it’s not over max server memory:

a38_semaphore_RTM

I ran the same test but kicked off a sixth query in SSMS. After 25 seconds I saw the following error for the sixth query:

Msg 8645, Level 17, State 1, Line 1
A timeout occurred while waiting for memory resources to execute the query in resource pool ‘default’ (2). Rerun the query.

I want my lawyer


On SQL Server 2017 CU14 I ran a variety of tests by changing the memory time-out settings at the Resource Governor query level or at the instance level. I tried different Resource Governor pools and even serial queries. I still saw a timeout of 25 seconds no matter what I did. I contacted the attorney that I keep on retainer to help me interpret SQL Server KB articles. Let’s review the relevant text again:

When you try to create a Columnstore Index on a table in Microsoft SQL Server 2016 or 2017, the request may fail after 25 seconds with memory time-out error 8645, depending on how many memory consuming queries are running concurrently and/or how much memory is available at the time of the request. The memory time-out error may occur even when you configure longer memory request time-out at an instance level or at a resource pool level.

He pointed out that the article doesn’t actually say that the time-out is now configurable. Just that it wasn’t configurable in the past. The symptom may strictly describe error 8645. So perhaps the adjustment was very narrow and has to do with avoiding that error only. Fair enough. I ran the same test that say error 8645 on RTM and the sixth query still hit error 8645.

Two of these things aren’t like the others


Let’s kick off five queries on CU14 and take another look at sys.dm_exec_query_memory_grants:

a38_memory_grant_new

That’s odd. The two queries that hit the 25 second timeout have lower values for max_used_memory_kb than the queries that didn’t time out, even though the memory grants are the same. Looking at sys.dm_db_column_store_row_group_physical_stats for one of the tables with the lower memory grant:

a38_rowgroup_stats

All rows were written to delta stores even though each thread got over 2 million rows. The query still takes its required memory grant but it doesn’t use most of the part reserved for columnstore compression. My best guess is that this is the change described in the KB article. A superficial glance suggests that the internal implementation is the same one used for writing to a delta store in serial:

a38_call_stacks

I think that I can understand the argument for making this change. However, I see intermittent intra-query parallel deadlocks when queries time out in this way:

Msg 1205, Level 13, State 78, Line 1
Transaction (Process ID 61) was deadlocked on lock | communication buffer resources with another process and has been chosen as the deadlock victim. Rerun the transaction.

I’ve also seen this error as well when going too far above target memory:

Msg 701, Level 17, State 123, Line 1
There is insufficient system memory in resource pool ‘default’ to run this query.

Personally, I’d like to see clearly defined behavior that focus on stability. When writing code that does parallel inserts into columnstore indexes it may be desirable to catch errors 8645, 1205, and 701 and to retry the insert after rolling back, perhaps at MAXDOP 1.

Final thoughts


Kb articles for SQL Server fixes can sometimes be misleading because they may focus on how the problem was described in a support ticket even if the scope of the fix or the solution have little to nothing to do with said description. After reading KB article 4480641 you could easily think that error code 8645 no longer occurs with parallel columnstore inserts or that it’s possible to override the 25 second memory timeout for columnstore inserts. Neither one of those is true. Parallel inserts into columnstore tables can still exceed target memory, but they write to multiple delta stores if they hit their 25 second timeout. Thanks for reading!

Extra Documentation for KB Article 4462481

SQL Server KB 4462481 is a bit light on details:

Assume that you use Microsoft SQL Server data warehousing. When you run parallel insert queries to insert data into a clustered columnstore index, the query operation freezes.

To quote one of the Top Men of SQL Server product support:

Hope this helps!

How to freeze your query


Consider a query execution that meets all of the following criteria:

  1. A parallel INSERT INTO… SELECT into a columnstore table is performed
  2. The SELECT part of the query contains a batch mode hash join
  3. The query can’t immediate get a memory grant, hits the 25 second memory grant timeout and executes with required memory

The query may appear to get stuck. It no longer uses CPU and the parallel worker threads appear to wait on each other. Let’s go through an example on SQL Server 2017 RTM. First create all of the following tables:

CREATE PARTITION FUNCTION PART_FUN_REP_SGM(BIGINT)AS RANGE LEFTFOR VALUES (1, 2, 3);CREATE PARTITION SCHEME PART_SCHEME_REP_SGMAS PARTITION PART_FUN_REP_SGMALL TO ( [PRIMARY] );DROP TABLE IF EXISTS dbo.SOURCE_DATA_FOR_CCI;CREATE TABLE dbo.SOURCE_DATA_FOR_CCI (PART_KEY BIGINT NOT NULL,ID BIGINT NOT NULL,FAKE_COLUMN VARCHAR(4000) NULL) ON PART_SCHEME_REP_SGM (PART_KEY);INSERT INTO dbo.SOURCE_DATA_FOR_CCI WITH (TABLOCK)SELECT TOP (1048576) 1, ROW_NUMBER()OVER (ORDER BY (SELECT NULL)) % 16000, NULLFROM master..spt_values t1CROSS JOIN master..spt_values t2OPTION (MAXDOP 1);INSERT INTO dbo.SOURCE_DATA_FOR_CCI WITH (TABLOCK)SELECT TOP (1048576) 2, ROW_NUMBER()OVER (ORDER BY (SELECT NULL)) % 16000, NULLFROM master..spt_values t1CROSS JOIN master..spt_values t2OPTION (MAXDOP 1);DROP TABLE IF EXISTS dbo.LARGE_BATCH_MODE_MEMORY_REQUEST;CREATE TABLE dbo.LARGE_BATCH_MODE_MEMORY_REQUEST (ID VARCHAR(4000),INDEX CCI CLUSTERED COLUMNSTORE);INSERT INTO dbo.LARGE_BATCH_MODE_MEMORY_REQUESTWITH (TABLOCK)SELECT TOP (2 * 1048576) CAST(ROW_NUMBER()OVER (ORDER BY (SELECT NULL)) AS VARCHAR(8000))+ 'DYEL'FROM master..spt_values t1CROSS JOIN master..spt_values t2;DROP TABLE IF EXISTS dbo.CCI_SLOW_TO_COMPRESS_TARGET_1;CREATE TABLE dbo.CCI_SLOW_TO_COMPRESS_TARGET_1 (ID BIGINT NULL,INDEX CCI CLUSTERED COLUMNSTORE);DROP TABLE IF EXISTS dbo.CCI_SLOW_TO_COMPRESS_TARGET_2;CREATE TABLE dbo.CCI_SLOW_TO_COMPRESS_TARGET_2 (ID BIGINT NULL,INDEX CCI CLUSTERED COLUMNSTORE);

Consider the following query:

INSERT INTO dbo.CCI_SLOW_TO_COMPRESS_TARGET_1WITH (TABLOCK)SELECT LEFT(t1.ID, 1)FROM LARGE_BATCH_MODE_MEMORY_REQUEST t1INNER JOIN LARGE_BATCH_MODE_MEMORY_REQUEST t2ON t1.ID = t2.IDUNION ALLSELECT IDFROM dbo.SOURCE_DATA_FOR_CCIOPTION (MAXDOP 2);

Here’s what the plan looks like:a37_plan
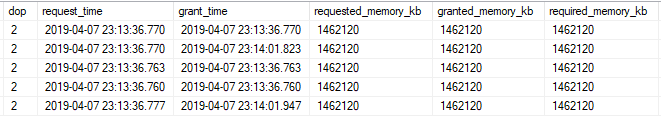
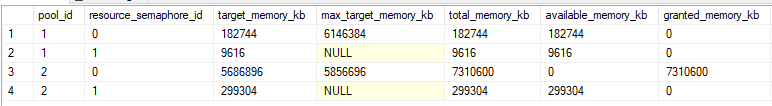
I set Max Server Memory to 8000 MB and executed two queries with a maximum allowed memory grant of 60% via Resource Governor. The first query finished in about 40 seconds. The second query hasn’t finished after 30 minutes. During those 30 minutes the second query has only used 1184 ms of CPU time. The COLUMNSTORE_BUILD_THROTTLE wait type shows up in sys.dm_os_waiting_tasks:a37_wait
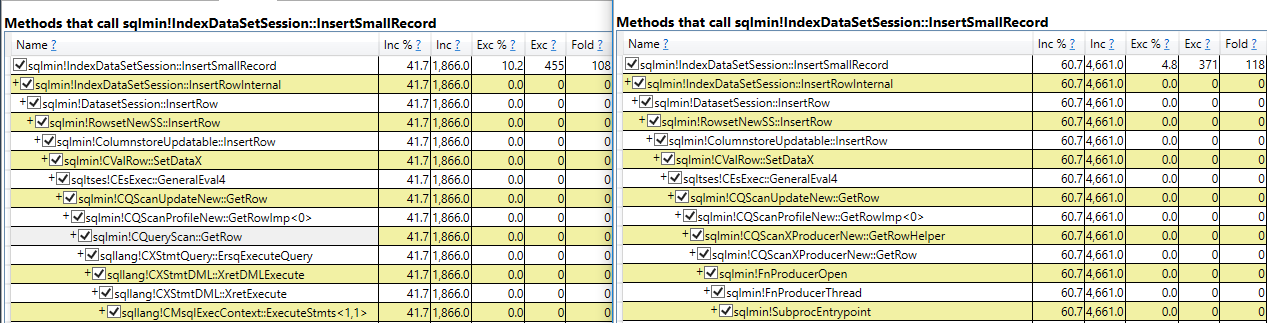
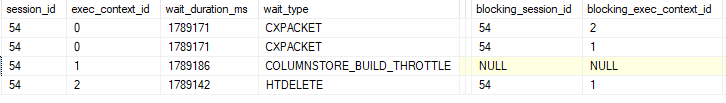
Execution context id 2 is waiting on execution context id 1 with a wait type of HTDELETE. Execution context id 1 has a wait type of COLUMNSTORE_BUILD_THROTTLE. I don’t think that this wait is supposed to show up for parallel inserts. It can show up by design when creating or rebuilding a columnstore index in parallel:

When a columnstore index is being built, the memory grant estimate is based on a segment size of one million rows. The first segment of the index is built using a single thread so the real, required per-thread memory grant is found. Then the memory grants are given per thread and the other segments are built multi-threaded. Although all the threads for the operation are allocated at the start of the build, only one thread is used for the first segment and all the others incur a COLUMNSTORE_BUILD_THROTTLE wait.

The important point is that a wait type of COLUMNSTORE_BUILD_THROTTLE means that worker thread is waiting on another thread to do something. But so does a wait time of HTDELETE. There are only two worker threads and both of them are waiting on another thread to do something. As a result, the query makes no progress. I’ve let similar queries run for 72 hours before giving up and killing them.

How to unfreeze your query


Upgrading to SQL Server 2017 CU11 or higher fixes the issue. With that said, if you’re seeing this issue that means that you have columnstore insert queries waiting at least 25 seconds for a memory grant. That should be considered to be a problem even if the queries didn’t get stuck. If you find yourself in this situation, I strongly consider increasing memory available to SQL Server or limiting memory grants via Resource Governor or some other method.

Final Thoughts


If you have parallel insert queries into CCis that appear to be stuck with no CPU usage and long COLUMNSTORE_BUILD_THROTTLE wait times check your version of SQL Server. Upgrading to at least CU11 will resolve the immediate issue, but consider a more complete fix will include addressing the RESOURCE_SEMAPHORE waits that must be present on your system.

Thanks for reading!

Going Further


If this is the kind of SQL Server stuff you love learning about, you’ll love my training. I’m offering a 75% discount to my blog readers if you click from here. I’m also available for consulting if you just don’t have time for that and need to solve performance problems quickly.

The Resource Governor MAXDOP Setting Can Lead to Poor Plan Choices In SQL Server

Resource Governor can be used to enforce a hard cap on query MAXDOP, unlike the sp_configure setting. However, query plan compilation does not take such a MAXDOP limit into account. As a result, limiting MAXDOP through Resource Governor can lead to unexpected degradations in performance due to suboptimal query plan choices.

Create Your Tables


We start with the not often seen here three table demo. I’d rather not explain how I came up with this sample data, so I’m not going to. I did my testing on a server with max server memory set to 10000 MB. The following tables take about half a minute to create and populate and only take up about 1.5 GB of space:

DROP TABLE IF EXISTS dbo.SMALL;
CREATE TABLE dbo.SMALL (ID_U NUMERIC(18, 0));

INSERT INTO dbo.SMALL WITH (TABLOCK)
SELECT TOP (100) 5 * ROW_NUMBER()
	OVER (ORDER BY (SELECT NULL))
FROM master..spt_values t1
CROSS JOIN master..spt_values t2
OPTION (MAXDOP 1);

DROP TABLE IF EXISTS dbo.MEDIUM;
CREATE TABLE dbo.MEDIUM (ID_A NUMERIC(18, 0));

INSERT INTO dbo.MEDIUM WITH (TABLOCK)
SELECT TOP (600000) ROW_NUMBER()
	OVER (ORDER BY (SELECT NULL))
FROM master..spt_values t1
CROSS JOIN master..spt_values t2
CROSS JOIN master..spt_values t3
OPTION (MAXDOP 1);

DROP TABLE IF EXISTS dbo.LARGE;
CREATE TABLE dbo.LARGE (
	ID_A NUMERIC(18, 0),
	ID_U NUMERIC(18, 0),
	FILLER VARCHAR(100)
);

INSERT INTO dbo.LARGE WITH (TABLOCK)
SELECT 2 * ( RN / 4), RN % 500, REPLICATE('Z', 100)
FROM
(
	SELECT TOP (8000000) ROW_NUMBER()
		OVER (ORDER BY (SELECT NULL)) RN
	FROM master..spt_values t1
	CROSS JOIN master..spt_values t2
	CROSS JOIN master..spt_values t3
) q
OPTION (MAXDOP 1)

CREATE INDEX IA ON LARGE (ID_A);
CREATE INDEX IU ON LARGE (ID_U);

The Long-Awaited Demo


I thought up the theory behind this demo on a car ride back from a SQL Saturday, but wasn’t able to immediately figure out a way to get the query plan that I wanted. I ended up finally seeing it in a totally different context and am now happy to share it with you. Consider the following query:

SELECT LARGE.ID_U
FROM dbo.SMALL
INNER JOIN dbo.LARGE ON SMALL.ID_U = LARGE.ID_U
INNER JOIN dbo.MEDIUM ON LARGE.ID_A = MEDIUM.ID_A
OPTION (MAXDOP 1);

The MAXDOP 1 hints results in a serial plan with two hash joins:

a36_MAXDOP1_plan

This is a perfectly reasonable plan given the size and structure of the tables. There are no bitmap filters because row mode bitmap filters are only supported for parallel plans. Batch mode is not considered for this query because I’m testing on SQL Server 2017 and there isn’t a columnstore index on any of the tables referenced in the query. On my machine a single query execution uses 2422 of CPU time and 2431 ms of elapsed time.

A parallel plan at MAXDOP 4 is able to run more quickly but with a much higher CPU time. A single execution of the MAXDOP 4 query uses 5875 ms of CPU time and 1617 ms of elapsed time. There are multiple bitmap filters present. I zoomed in on the most interesting part of the plan because I haven’t figured out how images work with WordPress yet:

a36_MAXDOP4_plan

Instead of doing a scan of the LARGE table, SQL Server instead chooses an index intersection plan. The cost of the additional hash join is reduced by multiple bitmap filters. There are only 2648396 and 891852 rows processed on the build and probe side instead of 8 million for each side, which is a significant gain.

Worse Than A Teen Running for Governor


Some end users really can’t be trusted with the power to run parallel plans. I thought about making a joke about an “erik” end user but I would never subject my readers to the same joke twice. After enforcing a MAXDOP of 1 at the Resource Governor level, you will probably not be shocked to learn that the query with the explicit MAXDOP 1 hint gets the same query plan as before and runs with the same amount of CPU and elapsed time.

If you skipped or forget the opening paragraph, you may be surprised to learn that the query with a MAXDOP 4 hint also gets the same query plan as before. The actual execution plan even has the parallel racing arrows. However, the query cannot execute in parallel. The parallelism and bitmap operators are skipped by the query processor and all of the rows are processed on one thread:

a36_MAXDOP4_with_RG

I uploaded the query plan here if you want to look at it. This type of scenario can happen even without Resource Governor. For example, a compiled parallel query may be downgraded all the way to MAXDOP 1 if it can’t get enough parallel threads.

The query performs significantly worse than before, which hopefully is not a surprise. A single execution took 12860 ms of CPU time and 13078 ms of elapsed time. Nearly all of the query’s time is spent on the hash join for the index intersection, with a tempdb spill and the processing of additional rows both playing a role. The tempdb spill occurs because SQL Server expected the build side of the hash join to be reduced to 1213170 rows. The bitmap filtering does not occur so 8 million rows were sent to the build side instead.

In this case, adding a MAXDOP 1 hint to the query will improve performance by about 5X. Larger differences in run times can be easily seen on servers with more memory than my desktop.

Final Thoughts


If you’re using using Resource Governor to limit MAXDOP to 1, consider adding explicit MAXDOP 1 hints at the query level if you truly need the best possible performance. The MAXDOP 1 hint may at first appear to be redundant, but it gives the query optimizer additional information which can result in totally different, and sometimes significantly more efficient, query plans. I expect that this problem could be avoided if query plan caching worked on a Resource Governor workload group level. Perhaps that is one of those ideas that sounds simple on paper but would be difficult for Microsoft to implement. Batch mode for row store can somewhat mitigate this problem because batch mode bitmap filters operate even under MAXDOP 1, but you can still get classic row mode bitmaps even on SQL Server 2019.

Thanks for reading!

Going Further


If this is the kind of SQL Server stuff you love learning about, you’ll love my training. I’m offering a 75% discount to my blog readers if you click from here. I’m also available for consulting if you just don’t have time for that and need to solve performance problems quickly.

What is the SOS_WORK_DISPATCHER Wait Type In SQL Server?

Upon upgrading to SQL Server 2019 CTP2, you may see the new SOS_WORK_DISPATCHER wait type at the top of the list:

a35_server_waits

The above screenshot is server level wait stats from my four core desktop after SQL Server was running for a few hours. SQL Server wasn’t really doing much since start up, so it felt unlikely that this wait was a sign of a problem. However, I was curious about what this wait type meant and wanted to know more.

A Call to Call Stacks


One of the few good things to come out of twitter was an announcement that public symbols are now available for SQL Server 2019 CTP2:

I for one appreciate the new, more open, Microsoft. Access to public symbols makes investigating unknown wait times significantly easier. Further helping the cause is the fact that the new wait type happens many times a second even when you aren’t doing anything in SQL Server. It was fairly easy to get call stacks for the wait using TF 3656, which is generally not recommended in production. Here is one example:

sqldk.dll!XeSosPkg::wait_info::Publish+0x1a9
sqldk.dll!SOS_Task::PreWait+0x14b
sqldk.dll!WaitableBase::Wait+0x183
sqldk.dll!WorkDispatcher::DequeueTask+0x5de
sqldk.dll!SOS_Scheduler::ProcessTasks+0x234
sqldk.dll!SchedulerManager::WorkerEntryPoint+0x2a1
sqldk.dll!SystemThread::RunWorker+0x91
sqldk.dll!SystemThreadDispatcher::ProcessWorker+0x2f3
sqldk.dll!SchedulerManager::ThreadEntryPoint+0x1e5
KERNEL32.DLL!BaseThreadInitThunk+0x14
ntdll.dll!RtlUserThreadStart+0x21

That’s a pretty short stack. The wait begins immediately after a task is dequeued. This made me think that workers start the wait when they don’t have a task to run and complete the wait once they do have a task to run, but this is hardly proof, since I’m just guessing at what this call stack means.

Just Add More Extended Events


From the call stack it seems reasonable to conclude that tasks are somehow related to the wait type. There are a handful of debug channel task related events available in extended events: task_completed, task_enqueued, and task_started. Debug extended events can be a pain because they often have no documentation, but these seemed straightforward enough. The event_counter target revealed very obvious collusion between the events:

a35_collusion

The wait_info extended event fires once for when a wait starts and once for when it completes. Every time I looked I had exactly twice as many events for wait_info as I did for each task-related extended event. Below is an instructive example from the event file. Note that the duration for the wait_info event is measured in milliseconds but the duration for the task event is measured in microseconds.

a35_XE_file

For worker 2434668749152, a task completed at 21:12:17.9416483. A wait type of SOS_WORK_DISPATCHER immediately began. About five seconds later, a task was enqueued to this worker. The SOS_WORK_DISPATCHER wait immediately ends after the task was enqueued, with a reported wait duration of 4998 ms. The task starts at 21:12:22.9397094 and completes at 21:12:22.9397109. Once again, a wait type of SOS_WORK_DISPATCHER immediately starts at 21:12:22.9397127. This time another task is very quickly enqueued at 21:12:22.9427744, so the wait ends with a duration of just 3 ms.

There are many similar patterns in the event file. I consider this to be pretty strong evidence that the SOS_WORK_DISPATCHER wait measures time that a worker sits idle without a task to run. It is common for systems to have many idle workers, so seeing a lot of wait time for SOS_WORK_DISPATCHER is normal and not cause for concern.

Robots are Taking Over


It is not clear to me why someone would be interested in this wait type. SQL Server automatically manages workers and creates and destroys them as needed. It’s true that as a query tuner I have some control over how many additional threads will be needed for a query, but if I’m investigating a performance or scalability problem I don’t care at all about the amount of time workers are sitting idle without a task to run. My wild guess is that this wait type was added to do some kind of tracking in Azure. Perhaps the robots needed some additional information to train a model.

Final Thoughts


In summary, the SOS_WORK_DISPATCHER wait type represents a sum of the total time for workers that don’t have tasks assigned to them. This appears to be a benign wait that can be filtered out of any queries on wait stats queries. When I first saw this wait type, I was hoping that it was some sort of representation of CPU idle time. I often work on workloads for which the goal is to push the server as hard as possible, so a simple measurement of total CPU idle time would be extremely useful for me. The number of workers on a system will change during a workload and there are lots of internal tasks, so sadly this wait type can’t be used for that type of analysis.

Thanks for reading!

Going Further


If this is the kind of SQL Server stuff you love learning about, you’ll love my training. I’m offering a 75% discount to my blog readers if you click from here. I’m also available for consulting if you just don’t have time for that and need to solve performance problems quickly.

What To Do When SQL Server Wait Stats Don’t Help

Some SQL Server workloads are slow even though there aren’t any hints in the wait stats that suggest ways to make them go faster. This blog post works through a columnstore example of such a workload.

The Test Setup


The test server has 96 physical cores. The test workload has many concurrent writers to the same columnstore target table. The source data is a simple staging table with ten columns. Each column contains sequential integers from 1 to 10485760. Here is T-SQL to create and populate the tables:

DROP TABLE IF EXISTS dbo.RS_SOURCE_10_COLUMN_SIMPLE;

CREATE TABLE dbo.RS_SOURCE_10_COLUMN_SIMPLE (
    ID1 BIGINT,
    ID2 BIGINT,
    ID3 BIGINT,
    ID4 BIGINT,
    ID5 BIGINT,
    ID6 BIGINT,
    ID7 BIGINT,
    ID8 BIGINT,
    ID9 BIGINT,
    ID10 BIGINT
);

INSERT INTO dbo.RS_SOURCE_10_COLUMN_SIMPLE
	WITH (TABLOCK)
SELECT q.ID, q.ID, q.ID, q.ID, q.ID
, q.ID, q.ID, q.ID, q.ID, q.ID
FROM
(
       SELECT TOP (10485760) ROW_NUMBER()
             OVER (ORDER BY (SELECT NULL)) ID
       FROM master..spt_values t1
       CROSS JOIN master..spt_values t2
       CROSS JOIN master..spt_values t3
) q
OPTION (MAXDOP 1);

DROP TABLE IF EXISTS dbo.CCI_TARGET_10_COLUMN;

CREATE TABLE dbo.CCI_TARGET_10_COLUMN (
    ID1 BIGINT,
    ID2 BIGINT,
    ID3 BIGINT,
    ID4 BIGINT,
    ID5 BIGINT,
    ID6 BIGINT,
    ID7 BIGINT,
    ID8 BIGINT,
    ID9 BIGINT,
    ID10 BIGINT,
    INDEX CCI0 CLUSTERED COLUMNSTORE
);

Concurrency is controlled by changing the number of stored procedures kicked off by a SQLCMD batch file. Each stored procedure does a single MAXDOP 1 insert from the staging table into the columnstore table. This test is different from the previous columnstore insert test documented here in that all of the sessions write to the same table and the source data gets significantly worse compression. In addition, each stored procedure only does a single insert, so the total overall work done increases as the number of concurrent sessions increases. If I run a single insert like the following:

INSERT INTO dbo.CCI_TARGET_10_COLUMN
SELECT *
FROM dbo.RS_SOURCE_10_COLUMN_SIMPLE
OPTION (MAXDOP 1);

That takes about 25 seconds to complete on the test server. It would be ideal if the average run time of the stored procedure stays at around 25 seconds as concurrency increases.

Test Results


We are not in an ideal world. The average run time of each stored procedure execution quickly increases with the number of concurrent sessions:

a34_scale_table

It may be slightly unreasonable to expect 96 concurrent sessions to scale perfectly well and to end up with an average run time of 24 seconds. With that said, the observed overhead is almost 4X at that scale. Let’s start by looking at wait stats:

a34_waits_for_LPIM_96

Most of the entries are related to memory. SOS_PHYS_PAGE_CACHE shows up because LPIM is enabled. This might be a helpful clue, but the waits only add up to about 10 seconds of waits per second. On a server with 96 cores that alone cannot explain a 4X degradation in scalability.

There is nothing helpful in latches:

a34_latches_for_LPIM_96

A number of spinlock collisions occurred during the workload:

a34_spins_for_LPIM_96

This is entirely a judgment call on my part, but based on my experience on this server and with similar workloads I don’t find those spinlock numbers to be at all remarkable. With that said, one avenue of investigation would be to dig into those spinlocks more.

From my point of view, the most important clue is that the server experiences high CPU throughout the workload according to SQL Server (using sys.dm_resource_governor_resource_pools), resource monitor, and perfmon. Perfmon also reports high privileged time:

a34_perfmon

SQL Server appears to be doing something which requires significantly more CPU at higher concurrency. Therefore, it makes perfect sense that the wait stats and latch stats alone aren’t very helpful. It’s reasonable to expect most wait types and latch classes to result in low CPU during their waits as opposed to high CPU.

ETW Tracing


ETW tracing can be used to diagnose CPU issues on servers. I’m still pretty new at it, but I use PerfView. In particular, what I really want to see is sampled call stacks to get an idea as to where CPU is being spent. I took a ten second sample during the 96 concurrent session workload and grouped by module name:

a34_perfview_LPIM_modules

The circled modules are typically what I see in SQL Server call stacks. SQL Server is responsible for the majority of CPU work on the server, but the majority of the work is done in the ntoskrnl and hal modules. I have it on good authority that CPU spent in that context will be tracked as privileged time in perfmon, so this roughly lines up with the perfmon graph previously shown.

A different view of the data reveals that most of the work is done as part of kernalbase!MapuserPhysicalPages:

a34_perfview_LPIM_just_my_app

In addition, we can see methods that call kernalbase!MapuserPhysicalPages:

a34_perfview_LPIM_methods_call_mapPhysicalPages

Presenting the data in a different way, we can see what was called by sqldk!SOS_MemoryWorkSpace::FreePage:

a34_perfview_LPIM_callee_free_Page

It appears that most of the CPU during the workload is spent returning memory from SQL Server to the OS. Backing that up, the memory commit for SQL Server was observed to decrease during the workload through resource monitor, even though there wasn’t any pressure from the OS and the total commit size was only at about 50% of max server memory.

For this workload, we are lucky in that important call stack names can be tied back to something in SQL Server. For example, sqldk!SOS_MemoryWorkSpace::FreePage would appear to be associated with freeing pages and that can be tracked from within SQL Server using extended events.

Extending The Investigation


The page_allocated and page_freed debug extended events are helpful in understanding how memory is allocated and freed during a query’s execution. First I started with a histogram target on memory_clerk_name for the page_freed event page_freed filtered to a single session. Here’s what that looks like:

a34_histogram

Nearly all of the free page events are for the MEMORYCLERK_SQLQERESERVATIONS clerk. I believe this clerk is responsible for granted query memory so this makes sense. Next we can turn on causality tracking and include the page_allocated event as well. Here’s a screenshot of some of the data for a simple CCI insert that processes three rowgroups in total:

a34_XE_picture

There are many different patterns in the data. Sometimes there is a series of free events and sometimes there is a series of allocation events. They can also alternate as shown in the picture above. The number of pages freed or allocated is usually one plus a power of two. I saved the data to a table and calculated a running total of current memory allocations for the query. The running total increased whenever pages were allocated and decreased whenever pages were freed. I’m really phoning it in with this graph, but here are the results:

a34_running_total_graph

The x-axis is time and the y-axis is total pages currently allocated to the query. This query compresses three rowgroups in total. That’s why the pattern repeats three times. Other than that, the only thing I was able to tie back to the compression algorithm was that pages are rapidly freed as segments are finished:

a34_segment_deallocations

In summary, page allocations and page free events rapidly occur, sometimes in an alternating pattern. SQL Server will often free a number of pages just to immediately request allocations for a similar number of pages. If all of the free page events result in returned memory to the OS then the reason for the scalability bottleneck becomes clear. When running the full workaround with 96 concurrent sessions, a total of 341965 page freed operations were performed. Those events freed about 71.3 million pages in total. That amounts to about 584 GB of memory returned to the OS in total, based on the previous assumptions.

It seemed bizarre to me for SQL Server to return so much memory to the OS during columnstore compression even though it would very likely immediately need more memory for compression. A colleague suggested that this could be a deliberate design decision by Microsoft to reduce the likelihood of out-of-memory errors when allocating memory above the max server memory setting:

“Starting with SQL Server 2012 (11.x), SQL Server might allocate more memory than the value specified in the max server memory setting. This behavior may occur when the Total Server Memory (KB) value has already reached the Target Server Memory (KB) setting (as specified by max server memory). If there is insufficient contiguous free memory to meet the demand of multi-page memory requests (more than 8 KB) because of memory fragmentation, SQL Server can perform over-commitment instead of rejecting the memory request.

This behavior is typically observed during the following operations:

Large Columnstore index queries.
Columnstore index (re)builds, which use large volumes of memory to perform Hash and Sort operations.”

What is Normal?


All of the above observations around memory allocations and freed memory are interesting but some additional context is needed. I suspect that it doesn’t, but it’s possible that a traditional row mode query would show the same pattern of allocated and freed pages. To investigate that, I created a row mode query with a memory consuming operator that processes a result set of rows, releases the rows, and continues to do so in a loop. The query plan looks like this:

a34_query_plan

Note the Hash Match (Aggregate) operator on the inner side of the nested loop. For each row in the DRIVE_ME table, SQL Server will send nearly all of the rows from DISTINCT_ONE_COL into the hash match operator. The reason that I went for this type of query is that it felt like the most similar pattern to columnstore compression in that compression processes up to 1048576 rows per thread in what’s effectively a loop. For those following along at home here is T-SQL to generate that query plan:

drop table if exists DRIVE_ME;

create table DRIVE_ME (ID INT);

INSERT INTO DRIVE_ME VALUES
(1), (2), (3), (4), (5), (6), (7),
(8), (9), (10), (11), (12), (13), (14);

drop table if exists DISTINCT_ONE_COL;

create table DISTINCT_ONE_COL (ID INT);

INSERT INTO DISTINCT_ONE_COL WITH (TABLOCK)
SELECT TOP (10000000) ROW_NUMBER()
      OVER (ORDER BY (SELECT NULL)) ID
FROM master..spt_values t1
CROSS JOIN master..spt_values t2
CROSS JOIN master..spt_values t3
OPTION (MAXDOP 1)

GO

CREATE OR ALTER PROCEDURE
dbo.REPEATED_ROW_MODE_ALLOC AS
BEGIN
SET NOCOUNT ON;
SELECT ca.cnt
FROM DRIVE_ME d
OUTER APPLY
(
	SELECT COUNT(DISTINCT ID)
	FROM DISTINCT_ONE_COL
	WHERE ID > d.ID
) ca (cnt)
OPTION (MIN_GRANT_PERCENT = 2.5)
END;

On the test server executing a single query took around 90 seconds. That single query execution frees around 760000 memory pages in total. Memory is allocated and freed in cycles. There isn’t a pattern where allocation and free events trade off between each other.

The workload does very well at scale. With 96 concurrent sessions the average stored procedure execution remains at around 90 seconds. We’re freeing the same amount of pages in total as the columnstore insert workload without seeing a drop in scalability. We can again use PerfView to analyze the workload by modules:

a34_perfview_rowstore_modules

This time most of the CPU is spent on SQL Server managed code. Drilling down, the operation that uses the most CPU appears to involving inserting rows into a hash table that’s in a query’s memory grant:

a34_perfview_rowstore_biggest_cpu

There isn’t necessarily anything wrong with this. After all, something needs to use the most CPU during the workload and we do achieve very good scalability. To me, the most important part is how call stacks are different when looking at everything called by sqldk!SOS_MemoryWorkSpace::FreePage:

a34_perfview_rowstore_callee_free_Page

Within SQLOS we call “FreeBlock” instead of “DecommitBlock”. The windows OS calls are significantly different compared to columnstore compression and I wasn’t able to observe the memory commit for SQL Server changing during the workload. I can’t say for sure, but it looks like when memory is freed for memory-consuming row mode operators it is returned to SQL Server as opposed to returned to the OS. That makes a big difference in scalability.

I wanted to test with batch mode memory consuming operators, but couldn’t figure out a query pattern that resulted in the number of processed rows getting constantly reset for an operator that didn’t involve UDFs. I will say that I observed memory getting returned to the OS during batch mode queries, but I did not immediately see the performance bottleneck around freeing the pages. It’s possible that with more work a demo could be created to show this bottleneck. It’s also possible that the different pattern of freed pages means that it won’t realistically happen. In my limited testing I did not see batch mode operators free pages before they had done all of their work, which is significantly different from the columnstore compression pattern of allocating and freeing pages.

Changing the Memory Model


We know that the problem has to do with memory deallocation, so testing with the conventional and large pages memory models may be fruitful. The workload significantly degraded without lock pages in memory. The average insert time was about 368 seconds with 96 concurrent sessions. 91% of the workload time can be tied back to memory related waits:

a34_convential_waits

At first glance, this workload has a problem with memory allocation as opposed to freeing memory pages. It would be possible to use techniques within SQL Server to further drill into the scalability bottleneck, but I will not do that analysis here.

Enabling large pages for the buffer pool via TF 834 does not resolve this bottleneck. The average insert completion time is nearly identical to the LPIM test and I did not observe any significant differences in PerfView results. TF 834 is helpful with some columnstore workloads but it does not help with this one. Keep in mind that TF 834 is not supported with columnstore according to Microsoft.

Waiting for a Wait Type


I’m not a cloud guy, but I wonder if it would even be possible to troubleshoot an issue like this if the investigator doesn’t have access to the underlying OS or the ability to install ETW tracing tools. It would be helpful if Microsoft was able to capture and present this bottleneck in SQL Server. For example, a new wait type could be defined named something like “RESERVED_MEMORY_FREE_EXT” with the timer starting after sqldk!SOS_MemoryWorkSpace::DeCommitBlock and ending after the OS owned code finishes its work. A defined wait type would make it much more obvious that there’s a problem and allow affected end users to easily search for guidance or workarounds for the issue. This would be a cpu busy external wait. I don’t know if defining a wait like this is in line with Microsoft’s general philosophy for designing wait types, but it’s just an idea.

If the bottleneck in the OS truly can’t be solved then perhaps it could be protected by a spinlock within SQL Server. That spinlock might not accomplish anything other than letting someone who only has access to SQL Server know that there’s a problem. Again I don’t know if that’s an appropriate use of a spinlock. I’m out of my depth here when it comes to suggestions like these, but I do think there is a need to classify this bottleneck. Of course, Microsoft making code changes in SQL Server or even in Windows Server to resolve the bottleneck would be preferred.

Final Thoughts


This blog post covered the investigation of a slow workload for which wait stats were not helpful in diagnosing the problem. In summary:

  1. ETW tracing and extended events revealed a bottleneck related to returning memory to the OS from SQL Server. This bottleneck can occur when loading data into columnstore tables at reasonably high concurrency.
  2. Lock pages in memory can have a dramatic effect on workload performance even when paging to disk is not occurring. This must be a gross oversimplification, but with LPIM SQL Server uses different OS calls to manage memory and the difference in those calls can lead to scalability issues with and without LPIM. For example, highly concurrent workloads that call HASHBYTES have been observed to get better throughput with LPIM.
  3. For columnstore workloads on SQL Server 2017, I recommend the use of LPIM unless there is a very good reason not to use it. I have seen LPIM cause performance issues on SQL Server 2016 but have not fully sourced those issues. LPIM still may be the right starting point on SQL Server 2016.
  4. The investigation did not have a happy ending in that it isn’t clear how to resolve the bottleneck except by lowering concurrency. However, the work done here does provide a helpful foundation for reaching out to a VM or Windows admin or for opening a support ticket with Microsoft.

Thanks for reading!

Going Further


If this is the kind of SQL Server stuff you love learning about, you’ll love my training. I’m offering a 75% discount to my blog readers if you click from here. I’m also available for consulting if you just don’t have time for that and need to solve performance problems quickly.

Can Rowstore Compression Beat Columnstore Compression In SQL Server?

Columnstore has quite a few different tricks for compressing data. This blog post explores if it’s possible for a rowstore table to beat columnstore compression, even in the best case scenario for the columnstore table (no delta stores and rowgropus of the maximum size).

Page Compression and String Data


Everybody knows that strings aren’t the best fit for columnstore tables. Let’s start by puting sequential integers from 1 to 1048576 into a page compressed table:

DROP TABLE IF EXISTS dbo.RS_VARCHAR33;
GO
CREATE TABLE dbo.RS_VARCHAR33 (
	ID1 VARCHAR(33)
) WITH (DATA_COMPRESSION = PAGE);

INSERT INTO dbo.RS_VARCHAR33 WITH (TABLOCK)
SELECT TOP (1048576) ROW_NUMBER()
	OVER (ORDER BY (SELECT NULL)) ID
FROM master..spt_values t1
CROSS JOIN master..spt_values t2
OPTION (MAXDOP 1);

According to sp_spaceused, the table takes up 11464 KB of space. Next load the same data into a columnstore table:

DROP TABLE IF EXISTS dbo.CCI_VARCHAR33;
GO
CREATE TABLE dbo.CCI_VARCHAR33 (
	ID1 VARCHAR(33),
	INDEX C CLUSTERED COLUMNSTORE
);

INSERT INTO dbo.CCI_VARCHAR33 WITH (TABLOCK)
SELECT TOP (1048576) ROW_NUMBER()
	OVER (ORDER BY (SELECT NULL)) ID
FROM master..spt_values t1
CROSS JOIN master..spt_values t2
OPTION (MAXDOP 1);

The CCI takes up 14408 KB of space. The majority of the space is used for the dictionary. The follow query returns 11495348 bytes:

SELECT csd.on_disk_size
FROM sys.column_store_dictionaries csd
INNER JOIN sys.partitions sp
	ON csd.partition_id = sp.partition_id
WHERE sp.[object_id] = OBJECT_ID('CCI_VARCHAR33');

Data types matter here. If I change the CCI to have a VARCHAR(32) column instead then the table only requires 1800 KB of space. A dictionary is not created in this case. A takeaway is that SQL Server may choose to create a dictionary based on the length of the defined string column. Data sets with many unique strings may require a relatively large amount of space for the dictionary, even to the point where page compressed data can have overall a lower footprint on the database.

Page Compression and Non-string Data


It’s certainly more difficult to come up with a demo that works without string columns, but consider how the page compression algorithm works. Data can be compressed on page basis, which includes both multiple rows and multiple columns. That means that page compression can achieve a higher compression ratio when a row has identical values in different columns. Columnstore is only able to compress on an individual column basis and you won’t directly see better compression with repeated values in different columns for a single row (as far as I know).

The table defined and populated below requires 11912 KB of disk space:

DROP TABLE IF EXISTS dbo.RS_4_COLUMN;
GO
CREATE TABLE dbo.RS_4_COLUMN (
	ID1 BIGINT,
	ID2 BIGINT,
	ID3 BIGINT,
	ID4 BIGINT
) WITH (DATA_COMPRESSION = PAGE);

INSERT INTO dbo.RS_4_COLUMN WITH (TABLOCK)
SELECT ID, ID, ID, ID
FROM (
	SELECT TOP (1048576) ROW_NUMBER()
		OVER (ORDER BY (SELECT NULL)) / 10 ID
	FROM master..spt_values t1
	CROSS JOIN master..spt_values t2
) q
OPTION (MAXDOP 1);

If I rerun the code with five columns, the table now takes up 13000 KB of space. That’s only an increase of 9% in space to hold 25% more data. The same data loaded into a columnstore table with four columns takes 11272 KB of space. Adding one column results in a total size of 14088 KB, which is almost exactly a 25% increase. For this data set with five columns, page compression across rows is more efficient than standard columnstore compression.

Row Compression and Non-string Data


Row compression doesn’t allow for compression benefits from storing the same value in multiple columns. Is it possible to beat columnstore compression with row compression without string columns? You betcha!

DROP TABLE IF EXISTS #BATCH_MODE;
CREATE TABLE #BATCH_MODE (
	ID INT,
	INDEX C CLUSTERED COLUMNSTORE
);

DROP TABLE IF EXISTS dbo.RS_2_COLUMN_ROW_COMPRESSED;
GO
CREATE TABLE dbo.RS_2_COLUMN_ROW_COMPRESSED (
	ID1 BIGINT,
	ID2 BIGINT
) WITH (DATA_COMPRESSION = ROW);

INSERT INTO dbo.RS_2_COLUMN_ROW_COMPRESSED WITH (TABLOCK)
SELECT
  SUM(q.ID) OVER (ORDER BY q.ID)
, SUM(q.ID) OVER (ORDER BY q.ID)
FROM
(
	SELECT TOP (1048576) ROW_NUMBER()
		OVER (ORDER BY (SELECT NULL)) ID
	FROM master..spt_values t1
	CROSS JOIN master..spt_values t2
) q
LEFT OUTER JOIN #BATCH_MODE ON 1 = 0
OPTION (MAXDOP 1);

EXEC sp_spaceused 'RS_2_COLUMN_ROW_COMPRESSED';

DROP TABLE IF EXISTS #BATCH_MODE;
CREATE TABLE #BATCH_MODE (
	ID INT,
	INDEX C CLUSTERED COLUMNSTORE
);

DROP TABLE IF EXISTS dbo.CCI_2_COLUMN;
GO
CREATE TABLE dbo.CCI_2_COLUMN (
	ID1 BIGINT,
	ID2 BIGINT,
	INDEX C CLUSTERED COLUMNSTORE
);

INSERT INTO dbo.CCI_2_COLUMN WITH (TABLOCK)
SELECT
  SUM(q.ID) OVER (ORDER BY q.ID)
, SUM(q.ID) OVER (ORDER BY q.ID)
FROM
(
	SELECT TOP (1048576) ROW_NUMBER()
		OVER (ORDER BY (SELECT NULL)) ID
	FROM master..spt_values t1
	CROSS JOIN master..spt_values t2
) q
LEFT OUTER JOIN #BATCH_MODE ON 1 = 0
OPTION (MAXDOP 1);

EXEC sp_spaceused 'CCI_2_COLUMN';

In this example, the rowstore table has a total size of 15496 KB but the columnstore has a total size of 16840 KB. I’m honestly not sure why this happens. I did try to pick the unfriendliest data set to columnstore compression that I could: no repeated values and no obvious patterns in data. Perhaps there’s some additional overhead of compression that pushes it over the row compressed data.

Final Thoughts


Columnstore doesn’t guarantee better compression than rowstore, even with perfectly sized rowgroups. Rowstore can provide better compression ratios for string columns, tables with repeated values across columns, and in other uncommon scenarios. A summary of test results is here:

a33_summary

The differences are small per rowgroup, but they can add up as more columns and more rows are added to the tables. I’ve seen tables in the real world that ended up bigger as columnstore compared to rowstore, which is what inspired me to look for some of these examples.

Thanks for reading!

Going Further


If this is the kind of SQL Server stuff you love learning about, you’ll love my training. I’m offering a 75% discount to my blog readers if you click from here. I’m also available for consulting if you just don’t have time for that and need to solve performance problems quickly.