Buggery
If you seriously want to debug, you’ve gotta use something like WinDbg. It’s tough, but powerful.
It’s also… Where do you even start? The most common thing to do is set a Break Point.
Figuring out where you wanna set it can be challenging.
- Sometimes you can capture a thread and step through the code.
- Sometimes you can find the call stack you want by searching through symbols
The problem with these is that stepping through code that runs in milliseconds has taken me over an hour at times, and call stacks often have cryptic names.
This is where tools like PerfView can help.
Not A Developer
I’m not a developer, or particularly smart. I wish particularly smart developers would blog about this in depth.
In the meantime, you’ll have to get the intro material from me. I recently used it to help answer a tough question.
There are times when traditional troubleshooting methods won’t help you.
Instructional
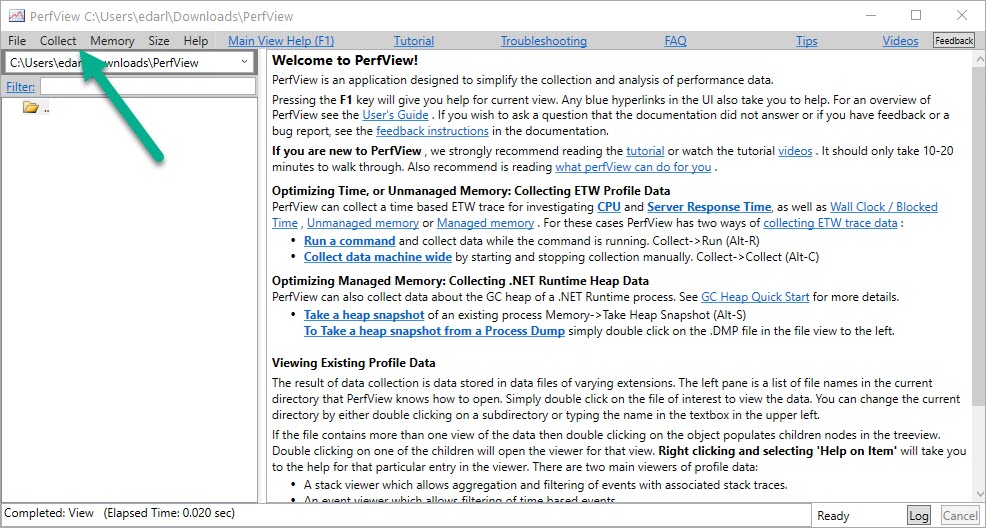
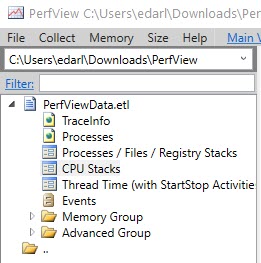
PerfView is just an executable. I like to stick it in its own folder; it keeps the files that get created together.
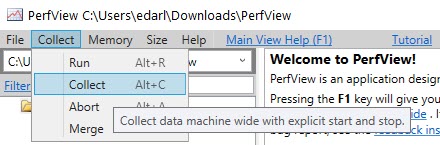
When you open it up, you’re gonna wanna hit the Collect menu.
Hit collect (or Alt+C, now that you peeked, cheater).
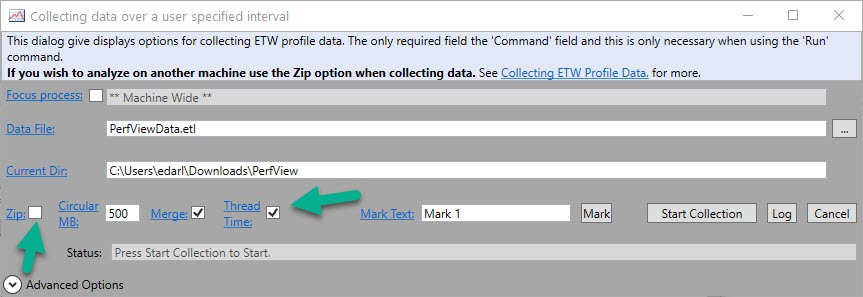
I usually skip zipping, unless I know I’m going to send these to someone else. You can always zip them later.
I like to grab thread time. I dunno why. I’ve always done it, and I’m superstitious.
I also listen to Planet Earth every time I’m on a plane taking off because it assures a safe trip. Right?
Right.
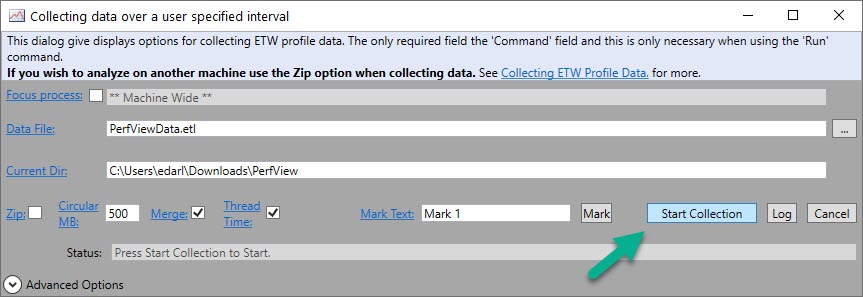
Next, when you’re ready to get stuff, hit Start Collection. This button will change to Stop Collection after you click it.
You’ll wanna stop the trace when the thing you wanna profile is done running, or when you think you’ve got sufficient sample.
Now, I have to warn you here. You don’t wanna take a long collection. These files get big.
You also have to factor in that profiling code can slow it down.
CPU stacks are where I go next. When you double click on that, you’ll get a pop up to pick which application you wanna dig into.
PerfView collects system wide. So really, please, please, please don’t run it for a very long time.
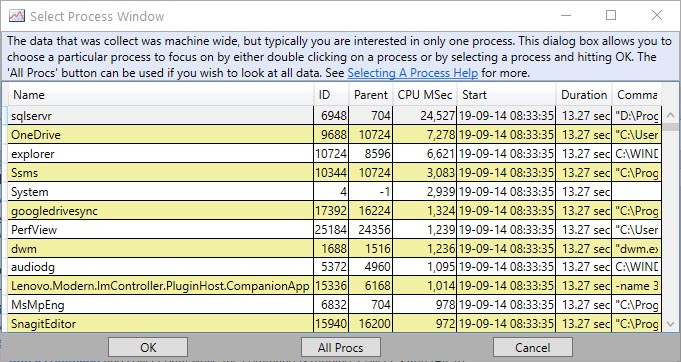
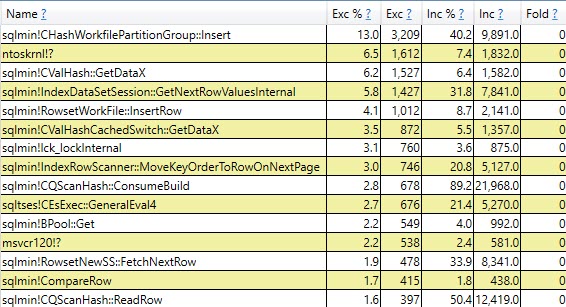
Double click into sqlservr, and you’ll get a list of stuff.
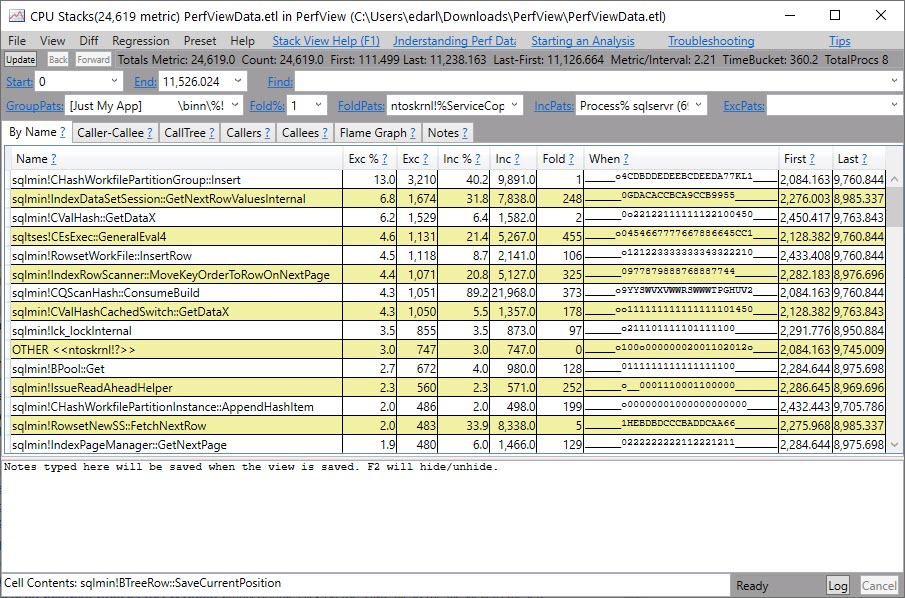
It won’t look like this for you at first. There’ll be a lot of jibberish and question marks. You need to get symbols for them to make sense.
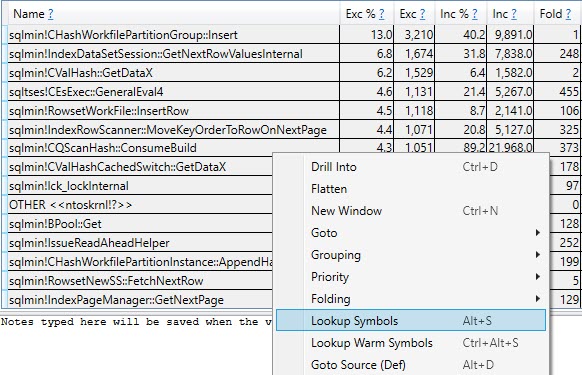
Hit ctrl+a to highlight the whole list of lines, then either hit alt+s or right click and select Lookup Symbols.
If it’s your first time doing this, it might take a while to download them, but you really need to do this part to make any sense of what’s going on.
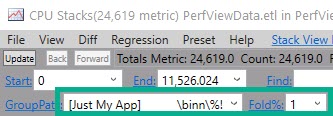
The next thing you wanna do is clear out GroupPats — just highlight, hit delete, and then enter.
Next, change Fold% to 0 and hit enter.
This’ll make sure you get the most detail from your sample.
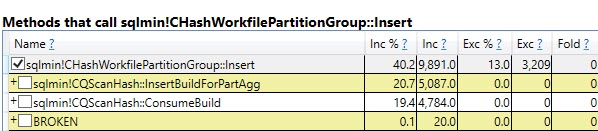
You can click around here to get other views of the data.
How Does This Relate To Debugging?
Well, see those list of call stacks up there? That’s what you use to set Break Points in a debugger.
You might see something interesting there that either doesn’t have the full detail you’re after, or you want to follow more closely.
Either way, this is a good example of how to take a closer look at what SQL Server is up to under the hood without getting lost in a debugger.
Thanks for reading!
Going Further
If this is the kind of SQL Server stuff you love learning about, you’ll love my training. I’m offering a 75% discount to my blog readers if you click from here. I’m also available for consulting if you just don’t have time for that and need to solve performance problems quickly.