If you’re like me, you’ve seen people posting information found through debugging SQL Server and thought “Yeah, I could be that cool”. If you want to see call stacks but failed to get anywhere with the debugger then this post might be for you. It contains step-by-step instructions for viewing SQL Server call stacks by creating a minidump.
What is a Minidump?
I will borrow a definition from Thomas Kejser’s blog post:
What is a dump? It is a file containing a snapshot of the running process – and parts or all of the memory space of that process. The snapshot also contains the call stack of every thread the process has created.
That last sentence is relevant to our interests. We can use minidumps to generate small files that contain SQL Server call stacks. Note that if you aren’t careful you can end up writing the full contents of memory to a dump file. I believe that writing the file is a single-threaded process, so this can take hours and hundreds of GBs on a real server. Also SQL Server is frozen while the dump is happening, so don’t do it in production.
Dumps are most useful when you want to examine a long running, very simple query or a query that seems to be stuck at a certain point. They aren’t useful to see a full call stack of a non-simple query or to see something that happens just once during execution, like a specific task during query compilation. All that you can get is a snapshot and the snapshot may not contain the information that you’re looking for.
There are multiple ways to generate and read dump files. For this blog post I’ll be using sqldumper.exe and WinDbg.
Using sqldumper.exe
First go to the directory that contains sqldumper.exe. On my machine for SQL Server 2016 the directory is C:\Program Files\Microsoft SQL Server\130\Shared . Open an admin command prompt and point it to that directory. Here are the arguments that we need to look at call stacks: C:\Program Files\Microsoft SQL Server\130\Shared>sqldumper
Usage: sqldumper [ProcessID [ThreadId [Flags[:MiniDumpFlags] [SqlInfoPtr [DumpDir
There are many ways to get the ProcessID for SQL Server. One way is to run the following SQL query:
SELECT SERVERPROPERTY('PROCESSID');
At the time of writing this post I have a process ID of 2364.
If ThreadId is set to 0 you’ll get information about all threads, including system threads that you might not be interested in. Sometimes you can get everything that you’re interested in by looking at a single thread for serial queries, or at a single thread if a parallel query appears to be throwing too much work at that thread. There’s probably a better way to write this query, but the query that I use to find the thread that I’m interested in is below:
SELECT th.os_thread_id, wta.wait_type
FROM sys.dm_os_threads th
INNER JOIN sys.dm_os_workers w
	ON th.worker_address = w.worker_address
INNER JOIN sys.dm_os_tasks tk
	ON w.task_address = tk.task_address
INNER JOIN sys.dm_os_waiting_tasks wta
	ON wta.waiting_task_address = tk.task_address
where tk.session_id = 56;
wait_type is there to give a clue about which threads are interesting. More columns can be added to the query as needed.
The Flags parameter controls which information is written to the dump file. There are many options and some of them write the full contents of memory to disk. The most useful ones that I’ve found are 0x0120 (dump minimal information about all threads) and 0x0100 (dump information about a single specified thread).
I always set SqlInfoPtr to 0 and don’t care to know what it does.
DumpDir is where the dump files are written to. Point it to your preferred place for leaving dumps, like Erik’s doorstep.
Getting the Call Stack
If your dump is successful then you’ll end up with a .mdmp file. This can be opened with your favorite debugging program. I use WinDbg because there are instructions for it and I generally don’t know what I’m doing. Open the program and go to File -> Open Crash Dump. Open your file and type the magic command:
~*kn
After a short while you'll see call stack information:
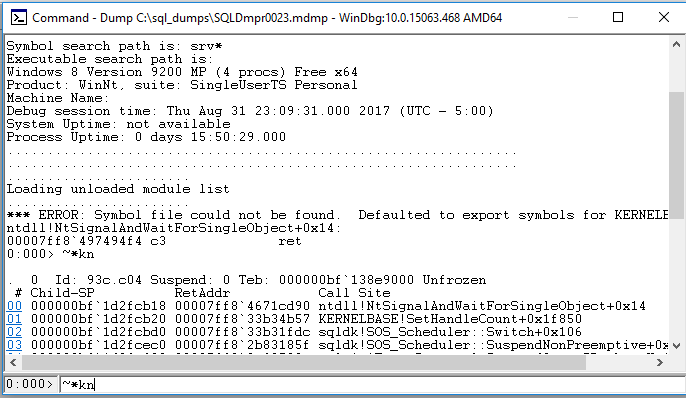
As far as I can tell, you have to close and reopen the program in order to open a new crash dump file. This is unfortunate, but it makes viewing the call stack that much sweeter.
Insert Example
Let's start with a simple example. How do call stacks differ when inserting into a heap vs a clustered index? For the source data I'll put 2 GB of pages into a clustered index:
DROP TABLE IF EXISTS dbo.source_ci;

create table dbo.source_ci (
	ID BIGINT NOT NULL,
	FILLER VARCHAR(7777) NOT NULL,
	PRIMARY KEY (ID)
);

INSERT INTO source_ci WITH (TABLOCK)
SELECT TOP (250000)
	ROW_NUMBER() OVER (ORDER BY (SELECT NULL))
	, REPLICATE('Z', 7777)
FROM master..spt_values t1
CROSS JOIN master..spt_values t2;
Here's the definition for the target table with a clustered index:
DROP TABLE IF EXISTS dbo.target_ci;

create table dbo.target_ci (
	ID BIGINT NOT NULL,
	FILLER VARCHAR(7777) NOT NULL,
	PRIMARY KEY (ID)
);
And here's the query that I want to get a dump of:
INSERT INTO dbo.target_ci WITH (TABLOCK)
SELECT *
FROM dbo.source_ci WITH (TABLOCK);
I previously wrote the source data to source_ci in order to make the insert query into target_ci as simple as possible. I want to maximize the chances that the call stack associated with the step of inserting rows into the table is present in the dump file. If the query to select the data for the insert is too complicated then I might not get what I'm looking for when I take a snapshot.
I started the insert, identified the thread of interest (8324), and dumped information for the single thread:
C:\Program Files\Microsoft SQL Server\130\Shared>sqldumper 2364 8324 0x0100 0 c:\sql_dumps
Parsed parameters:
ProcessID = 2364
ThreadId = 8324
Flags = 0x100
MiniDumpFlags = 0x1160
SqlInfoPtr = 0x0000000000000000
DumpDir = c:\sql_dumps
ExceptionRecordPtr = 0x0000000000000000
ContextPtr = 0x0000000000000000
ExtraFile =
PatternForExtraFiles =
InstanceName =
ServiceName =
Remote process didn't specify a dump file name
Target suspended
Callback type 11 not used
Callback type 15 not used
Callback type 7 not used
MiniDump completed: c:\sql_dumps\SQLDmpr0024.mdmp
Total Buffer pool data pages filtered out: 0 KB
Total Hekaton data pages filtered out: 0 KB
Total Free memory (from non top level allocators) filtered out: 0 KB
Total top level free memory filtered out: 0 KB
Total Log pool memory filtered out: 0 KB
Location of module 'dbghelp.dll' : 'C:\Program Files\Microsoft SQL Server\130\Shared\dbghelp.dll'
File version of module 'C:\Program Files\Microsoft SQL Server\130\Shared\dbghelp.dll' : '6.12:2.633'
Product version of module 'C:\Program Files\Microsoft SQL Server\130\Shared\dbghelp.dll' : '6.12:2.633'
Location of module 'sqldumper.exe' : 'C:\Program Files\Microsoft SQL Server\130\Shared\SqlDumper.exe'
File version of module 'C:\Program Files\Microsoft SQL Server\130\Shared\SqlDumper.exe' : '2015.130:1601.5'
Product version of module 'C:\Program Files\Microsoft SQL Server\130\Shared\SqlDumper.exe' : '13.0:1601.5'
Watson Invoke: No
I did the same thing with a heap target table (with a MAXDOP 1 hint), and diffed the call stacks:
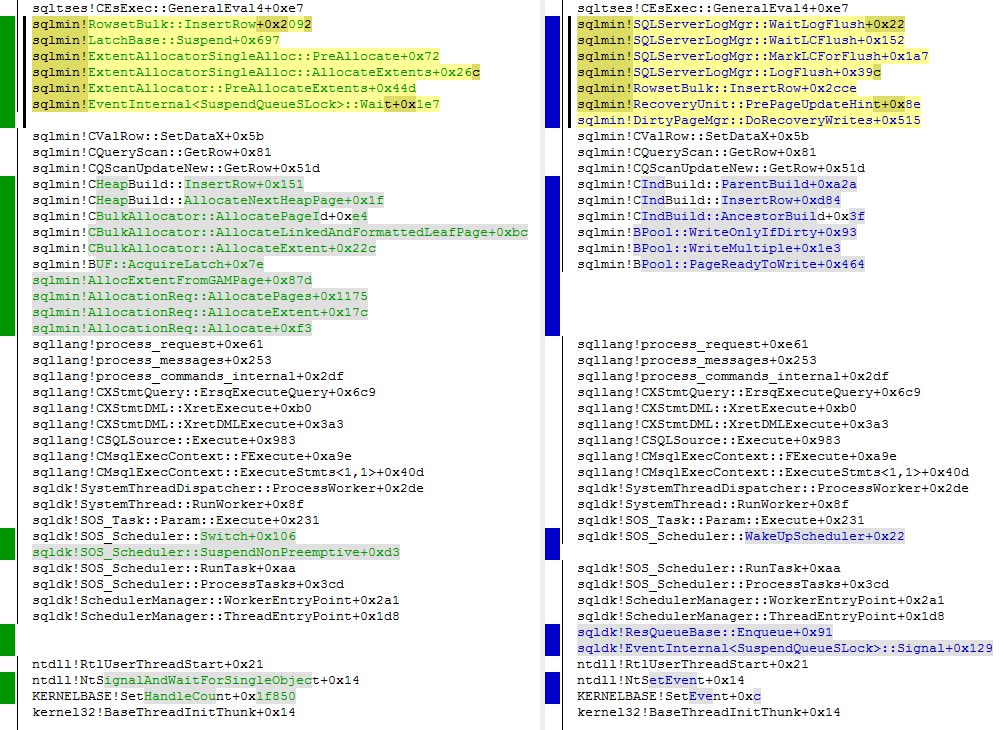
Some of the function names are the same, which makes a lot of sense. We're reading from the same source table. Of course there are differences as well. For example, for the heap we see sqlmin!CHeapBuild::InsertRow+0x151 and for the clustered index we see sqlmin!CIndBuild::InsertRow+0xd84. That's pretty neat.
Stuck Query Example
For the next example I'll use my favorite query that never finishes. First we need to create a few tables:
DROP TABLE IF EXISTS dbo.TestDriver;

CREATE TABLE dbo.TestDriver
(
    n integer NOT NULL,
    n2 integer NOT NULL
);

-- 100k rows
INSERT dbo.TestDriver WITH (TABLOCK) (n, n2)
SELECT TOP (100000)
CHECKSUM(sv1.number, NEWID()), CHECKSUM(sv1.number, NEWID())
FROM master.dbo.spt_values AS SV1
CROSS JOIN master.dbo.spt_values AS SV2
OPTION (MAXDOP 1);

DROP TABLE IF EXISTS dbo.TestCCI;

CREATE TABLE dbo.TestCCI
(
    n integer NOT NULL,
    INDEX ccsi CLUSTERED COLUMNSTORE
);

-- 10 M rows
INSERT dbo.TestCCI WITH (TABLOCK) (n)
SELECT TOP (10 * 1000 * 1000)
CHECKSUM(sv1.number, NEWID())
FROM master.dbo.spt_values AS SV1
CROSS JOIN master.dbo.spt_values AS SV2
CROSS JOIN master.dbo.spt_values AS SV3
OPTION (MAXDOP 1);
The following query seemingly runs forever:
SELECT CA.x
FROM
(
    SELECT TOP (1) n2
    FROM dbo.TestDriver
    ORDER BY n ASC, n2 DESC
) AS T1 (id2)
CROSS APPLY
(
    SELECT COUNT_BIG(*)
    FROM dbo.Test AS T2
    WHERE T2.n <= T1.id2
) AS CA (x);
Viewing a call stack could be helpful once you've exhausted the usual ways of trying to figure out why the query isn't finishing. If I run the query to get thread information I see that os_thread_id 4176 has a wait type of CXPACKET (zzzzz) and os_thread_id 3076 has a wait type of HTBUILD. Time to take a dump:
sqldumper 2364 3076 0x0100 0 c:\sql_dumps
After running the magic command:
ntdll!NtSignalAndWaitForSingleObject+0x14
KERNELBASE!SetHandleCount+0x1f850
sqldk!SOS_Scheduler::Switch+0x106
sqldk!SOS_Scheduler::SuspendNonPreemptive+0xd3
sqlmin!EventInternal::Wait+0x1e7
sqlmin!CSyncPoint::WaitAtNthGate+0x1ac
sqlmin!CSyncPoint::Wait+0x13e
sqlmin!CBpSpillProcessor::Main+0xf8
sqlmin!CBpQScanHashAggNew::BpGetNextBatch+0x52
sqlmin!CQScanBatchHelper::GetRow+0x97
sqlmin!CQScanNLJoinTrivialNew::GetRow+0x12c
sqlmin!CQScanProfileNew::GetRowImp<0>+0x11d
sqlmin!CQScanXProducerNew::GetRowHelper+0x63
sqlmin!CQScanXProducerNew::GetRow+0x15
sqlmin!FnProducerOpen+0x5b
sqlmin!FnProducerThread+0x7a9
sqlmin!SubprocEntrypoint+0x10ab
sqldk!SOS_Task::Param::Execute+0x231
sqldk!SOS_Scheduler::RunTask+0xaa
sqldk!SOS_Scheduler::ProcessTasks+0x3cd
sqldk!SchedulerManager::WorkerEntryPoint+0x2a1
sqldk!SystemThread::RunWorker+0x8f
sqldk!SystemThreadDispatcher::ProcessWorker+0x2de
sqldk!SchedulerManager::ThreadEntryPoint+0x1d8
kernel32!BaseThreadInitThunk+0x14
ntdll!RtlUserThreadStart+0x21
Now you can write even more detailed connect items that will never get fixed!
Final Thoughts
Now you can impress your friends with call stacks, as long as you have easily impressed friends.
Thanks for reading!
Going Further
If this is the kind of SQL Server stuff you love learning about, you'll love my training. I'm offering a 75% discount to my blog readers if you click from here. I'm also available for consulting if you just don't have time for that and need to solve performance problems quickly.
One thought on “Dumping Call Stacks In SQL Server”
Comments are closed.