SQL Server recently surprised me with unexpected minimal logging. Normally this would be a cause for celebration but I was designing demos for a class. The point of that particular demo was to demonstrate a case in which minimal logging did not occur. The specific test case was inserting into a rowstore clustered index without a TABLOCK hint. Per the documentation, I should not have gotten minimal logging unless trace flag 610 was turned on. I was testing on SQL Server 2016 without trace flag 610.
Trace Flag 610
This trace flag is documented by Microsoft in The Data Loading Performance Guide. Here’s a relevant quote:
Not every row inserted in a cluster index with trace flag 610 is minimally logged. When the bulk load operation causes a new page to be allocated, all of the rows sequentially filling that new page are minimally logged. Rows inserted into pages that are allocated before the bulk load operation occurs are still fully logged, as are rows that are moved as a result of page splits during the load.
In addition, you can see a table of expected logging results if you search for “Summarizing Minimal Logging Conditions”. That table confirms that minimal logging should not happen when inserting into a clustered index without TABLOCK or trace flag 610. However, that’s exactly what I saw on SQL Server 2016.
SQL Server 2014 Testing
In a state of panic I immediately downloaded and installed SQL Server 2014 Express. Well not really, but it makes for a better blog post. For these tests I’m using a recovery model of simple.
Simple Inserts
First I’ll insert 2500 pages into a clustered rowstore table with a few different options. Table schema:
DROP TABLE IF EXISTS dbo.target_ci;

CREATE TABLE dbo.target_ci (
	ID BIGINT NOT NULL,
	FILLER VARCHAR(7700) NOT NULL,
	PRIMARY KEY (ID)
);
I’ll be checking out what’s getting logged with these queries:
SELECT SUM(database_transaction_log_bytes_used)
FROM sys.dm_tran_database_transactions
WHERE DATABASE_ID = 7;
-- you probably have a different database ID

SELECT Operation, COUNT(*)
FROM fn_dblog(NULL, NULL)
GROUP BY Operation
ORDER BY COUNT(*) DESC;
The first test is with TABLOCK, the second is without TABLOCK, and the third is without TABLOCK but with trace flag 610 enabled. I should get minimal logging for the first and the third and not for the second. Here’s the code that I ran:
CHECKPOINT;
BEGIN TRANSACTION;

INSERT INTO dbo.target_ci WITH (TABLOCK)
SELECT TOP (2500)
  ROW_NUMBER() OVER (ORDER BY (SELECT NULL))
, REPLICATE('Z', 7700)
FROM master..spt_values;

-- pause here

COMMIT TRANSACTION;
TRUNCATE TABLE dbo.target_ci;
CHECKPOINT;

BEGIN TRANSACTION;

INSERT INTO dbo.target_ci
SELECT TOP (2500)
  ROW_NUMBER() OVER (ORDER BY (SELECT NULL))
, REPLICATE('Z', 7700)
FROM master..spt_values;

-- pause here

COMMIT TRANSACTION;
TRUNCATE TABLE dbo.target_ci;
CHECKPOINT;

DBCC TRACEON(610);

BEGIN TRANSACTION;

INSERT INTO dbo.target_ci
SELECT TOP (2500)
  ROW_NUMBER() OVER (ORDER BY (SELECT NULL))
, REPLICATE('Z', 7700)
FROM master..spt_values;

-- pause here

COMMIT TRANSACTION;
TRUNCATE TABLE dbo.target_ci;
CHECKPOINT;
According the transaction log DMV, the first test logged 78,464 bytes, the second test logged 22,157,848 bytes, and the third logged 2,140,124 bytes. These results were expected. Below is a table of results from the undocumented fn_dblog TVF:
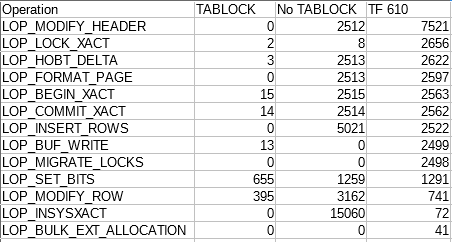
I omitted out the (hopefully) irrelevant data. I don’t know what any of it means, but we can clearly see differences between the three tests. Based on this simple testing, SQL Server 2014 appears to match the documentation.
Page Splits
We can also do a simple test to show a case where trace flag 610 doesn’t help. First insert 2500 rows with odd primary keys from 1 to 4999:
CREATE TABLE dbo.NO_NEW_PAGES (
	ID BIGINT NOT NULL,
	DATA VARCHAR(3800),
	PRIMARY KEY (ID)
);

INSERT INTO dbo.NO_NEW_PAGES WITH (TABLOCK)
SELECT TOP (2500)
  -1 + 2 * ROW_NUMBER() OVER (ORDER BY (SELECT NULL))
, REPLICATE('Z', 3800)
FROM master..spt_values;
Then insert 2499 rows with even primary keys from 2 to 4998 with and without TF 610:
DBCC TRACEON(610);

BEGIN TRANSACTION;

INSERT INTO dbo.NO_NEW_PAGES
SELECT TOP (2499)
  2 * ROW_NUMBER() OVER (ORDER BY (SELECT NULL))
, REPLICATE('Z', 3800)
FROM master..spt_values;

-- pause here

ROLLBACK TRANSACTION;

DBCC TRACEOFF(610);

BEGIN TRANSACTION;

INSERT INTO dbo.NO_NEW_PAGES
SELECT TOP (2499)
  2 * ROW_NUMBER() OVER (ORDER BY (SELECT NULL))
, REPLICATE('Z', 3800)
FROM master..spt_values;

-- pause here

COMMIT TRANSACTION;
I expect a lot of page splitting because I can now fit two rows per page. TF 610 shouldn’t handle this scenario well. I logged 16,575,608 bytes with the trace flag and 9,796,224 bytes without the trace flag according to the transaction log DMV.
Nonclustered Indexes
Trace flag 610 can help with nonclustered indexes. Below is a test that inserts 2500 rows with and without trace flag 610 with an index on a new column:
CREATE TABLE dbo.IX_TEST (
	ID BIGINT NOT NULL,
	ID2 BIGINT NOT NULL,
	DATA VARCHAR(3800),
	PRIMARY KEY (ID)
);

CREATE INDEX IX ON IX_TEST (ID2);

DBCC TRACEON(610);

BEGIN TRANSACTION;

INSERT INTO dbo.IX_TEST
SELECT TOP (2500)
  ROW_NUMBER() OVER (ORDER BY (SELECT NULL))
, ROW_NUMBER() OVER (ORDER BY (SELECT NULL))
, REPLICATE('Z', 3800)
FROM master..spt_values;

-- pause here

ROLLBACK TRANSACTION;

DBCC TRACEOFF(610);

BEGIN TRANSACTION;

INSERT INTO dbo.IX_TEST
SELECT TOP (2500)
  ROW_NUMBER() OVER (ORDER BY (SELECT NULL))
, ROW_NUMBER() OVER (ORDER BY (SELECT NULL))
, REPLICATE('Z', 3800)
FROM master..spt_values;

-- pause here

COMMIT TRANSACTION;
There was an order of magnitude difference. With trace flag 610 I logged 1,129,728 bytes and without trace flag 610 I logged 10,120,144 bytes.
SQL Server 2016 Testing
I ran the same tests again on SQL Server 2016 SP1-CU3. With TABLOCK I logged 111,568 bytes according to the transaction log DMV. For both other tests I logged 2,125,376 bytes. Here’s a table of results from fn_dblog:
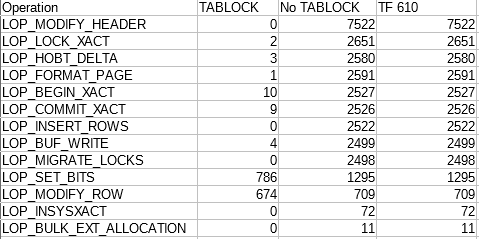
Despite what the table says, note that the results with and without the trace flag weren’t exactly the same. However, even when running the same test sometimes the number of logged records per operation varies a little bit. My conclusion was that SQL Server is doing the same thing behind the scenes.
For both the page splitting and the nonclustered index test I got the same results as in SQL Server 2014. This shows that trace flag 610 does have some effect in SQL Server 2016, but not the one you’d expect from reading the documentation.
Estimated Final Thoughts
It appears that Microsoft has added additional minimal logging optimizations for clustered rowstore tables in SQL Server 2016. At least one of these optimizations was previously locked behind trace flag 610. I could not find any mention of this change in the documentation. If you carried over trace flag 610 when upgrading to SQL Server 2016, you should consider retesting that trace flag with your workload. It’s possible to construct a workload that benefits from trace flag 610 in SQL Server 2014 but is harmed by the same trace flag in SQL Server 2016.
Actual Final Thoughts
As of August 1, Microsoft documented that trace flag 610 is a no-op in SQL Server 2016. I revisited my results and found issues with the page splitting and nonclustered index tests. Starting with an empty table, inserting rows, and rolling back that transaction can affect the amount written to the log for future transactions. I don’t know why, but it’s necessary to drop and recreate the table before changing the trace flag to get clean results. It appears to be safe to turn off trace flag 610 in SQL Server 2016.
Thanks for reading!
Going Further
If this is the kind of SQL Server stuff you love learning about, you’ll love my training. I’m offering a 75% discount to my blog readers if you click from here. I’m also available for consulting if you just don’t have time for that and need to solve performance problems quickly.
One thought on “Trace Flag 610 and SQL Server 2016”
Comments are closed.